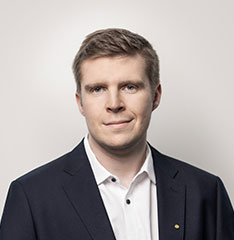
Professional Data Science portrait with Jan Allemann: Chief Revenue Officer (CRO)
Our former HSLU and Applied Information and Data Science student Jan Allemann is sharing with us some insights into his everyday working- and study life. Stepping fast ahead in his career, he was alredy promoted to the Chief Revenue Officer (CRO) at Cowa Thermal Solutions AG. Jan is now responsible for all steps in industrializing the product and also for the sales strategy. We also learned what he enjoyed most during his studies.
Shortcuts: Interview – Info-Events – Applied Data Science Master’s programme Info – Contact – Professional Data Science portraits
Jan Allemann
Chief Revenue Officer (CRO) @ Cowa Thermal Solutions AG
#digitalmarketing #dataanalysis #interdisciplinary #staycurious #responsibility
#sustainability #sports
First of all, tell us something about yourself: Which hashtags describe you the best?
#interdisciplinary #staycurious #responsibility #sustainability #teamsport
Tell us a bit more about them.
I have always been more interested in discovering the manifold connections among subject areas than in drilling down to the last detail of a single topic. Although I’ve worked intensively on certain topics over the years, this personal trait is reflected in my curriculum vitae, which documents my work in mechanical engineering, data science and business. Furthermore, I’m also aware of how much specialized experts with a love for detail are in demand, which brings me to my last hashtag: #teamsport. No other place has taught me more about how we as a team can challenge each other and learn.
Now let’s talk about your professional life: What do you do at Cowa Thermal Solutions AG?
We are a start-up from Lucerne and will soon be launching an innovative product for thermal energy storage. Since February 2021, I’ve been responsible for all steps in industrializing the product and new also for the sales strategy.
What did you do previously and why did you join Cowa Thermal Solutions AG?
My background is in mechanical engineering. I first worked as a design engineer at Bosch and then joined Zühlke Engineering as a systems engineer after I got my degree. Both were very exciting companies and professions, but as I already mentioned, I’ve always been interested in other areas, such as computer science, general business fields, and renewable energies. That’s how I ended up in the MSc program in data science and the job as a marketing analyst for a software company in Boston. I got my current job through my network at Lucerne University of Applied Sciences and Arts. Cowa was looking exactly for someone with my rather unusual profile, and I didn’t hesitate for a second, as the product, the company, and the challenging position appealed to me.
Tell us about the most exciting thing in your job.
We are a start-up, which is why many processes are still undefined and software decisions are still pending. On the other hand, it means we can build our company by using cutting-edge knowledge and best practices. We are not stuck with legacy systems or outdated processes – a very privileged and exciting place to be in. That’s why – especially in my field around the marketing strategy and sales channels – I strive to be as data-driven and digital as possible.
Which data science skills are especially in demand in your job?
In our production, the key is knowing right from the start what questions we want to put to the data and what it is we want to learn. This way, we can ensure that we collect the right data in the first place and set up appropriate sensors and measurement procedures. On the market side, I’m currently working on our target accounts and using analytics tools to learn which sales arguments generate the most interest.
In addition, the MSc in Applied Information and Data Science also offers a significant number of modules on business model development, customer experience or management. This has given me some very valuable things that I can apply directly every day.
Do you think of yourself more as a techie or as an analyst? Or as a creative genius, management superhero or generalist wiz?
Whew! I guess I would say that I’m a generalist, based on my answers above 😊. But there’s definitely a techie somewhere deep down inside, as I also like to keep myself busy with the latest technical achievements in my private life. However, my broad background and generalist traits tend to dominate everyday professional life.
What do you remember the most when you look back at your time in the MSc in Applied Information and Data Science program?
A culture shock in the positive sense when I started my semester abroad in Boston. In Switzerland, I had to explain again and again what data science actually is and what exactly it is that I was studying. In Boston, however, I hardly met anyone who didn’t work in the field of data or computer science or who had taken at least a basic course in Python just for the fun of it. That impressed me a lot, and I think that we in Switzerland still have some catching up to do in this respect.
What are the biggest challenges in your job at the moment?
Every day I’m confronted with tasks that are completely new to me. Although it’s possible to build a company on a greenfield site, doing so also involves a lot of challenges and difficulties when it comes to deciding on the right principles to pursue. So it’s crucial for me to know when to decide for myself and when to ask for advice from more experienced people. I find this to be very exciting and I’m glad that I’ve acquired the necessary tools to master the challenges while I was studying.
What advice would you have for others starting in the same job?
The following – especially for those with little experience in coding: Stick with it! Even if it may seem painful at first, you’ll notice fascinating things happening eventually.
And finally: What new hashtag are you aiming for in 2022?
#digitalmarketing
We at Cowa are planning to significantly increase our market activities in the coming months – hopefully by using data the way I learned during the program.
Start your career with the MSc in Applied Information and Data Science now!
Register and join us for a free online Info-Event:
Monday, 13 April 2026 (Online, German)
Monday, 27 April 2026 (Online, German)
Monday, 11 May 2026 (Online, English)
Monday, 26 May 2026 (Online, German)
Monday, 8 June 2026 (Online, German)
Monday, 10 August 2026 (Online, English)
Many thanks to Jan Allemann for this interesting interview and the insights into your job!