Sports Hackdays 2021 – Challenge: Moneyball goes Football
The challenge of group 8 was to create appealing and insightful visualisations for football fans and lovers. The visualisation is meant to show data about football players and give a football enthusiast the possibility to compare different metrics about football players. The goal was to create ideas and a prototype that could be implemented in the online newspaper “Watson”, to attract more football fans to their homepage.
Author: Philipp Schaad,
Challenge owner: Datahouse, Watson
Table of Contents
1. Introduction
2. Data
3. Ideation
4. Development
5. Results
6. Conclusion
Introduction
The challenge 8 was owned by Datahouse, a Data Science consultancy from Zurich and
Watson, a free swiss online news platform. The goal of the challenge was to develop an
appealing, easy to use, interactive visualisation, where datapoints of football players can be
compared. This gives a potential visitor of Watson the possibility to compare his or her
favourite football players in regard of different metrics.
The fellow participants of the challenge have voluntarily chosen to contribute to this task.
We were a mixed team of data science students in different semesters, one student from
the Swiss Federal Institute of Sport Magglingen and the challenge owners from Datahouse
and Watson. Some of us with a prior knowledge about football and some with less
knowledge about football.
Data
The data for our challenge was given. It’s web-scraped data from different websites about football. The raw data contains 159 variables from about 4000 football players from the top five national leagues in Europe. Those leagues are:
• Ligue 1 from France
• Serie A from Italy
• Bundesliga form Germany
• La Liga from Spain
• Premier League from the United Kingdom
An additional datafile from one of the challenge members was available to add more information. This file contains information about the players monetary market values when they were transferred from one football club to another. This file contains 27’2338 observations and 26 variables. Those two datafiles were the basic, where we could build our ideas upon.
Ideation
When we started, we had an initial look at the available variables in the data so we could generate ideas of what we will be able to visualize on the dashboard. As a next step, we started to generate ideas about possible visualisations and comparisons that could be of interest for a Watson visiting football enthusiast.
During this process we agreed to build a dashboard. There were many different ideas what could be visualized on such a dashboard. Finally, we have decided on four elements, and all the four elements show different insights about the players.
One element on the dashboard was a similarity analysis between two players, where different metrics are compared. The second element should be a machine learning model, which compares the players and returns the “best player”. And the third element should
become a plot, where the user can choose between two variables and compare players
based on those variables.
We then split the team in different groups to work on the different elements for the
dashboard. I was mostly involved in building the machine learning model.
Development
To develop the solution, our team agreed on using R and building the dashboard as an RShiny application. R is straight forward for implementing fast prototypes and showing first results. There are lots of packages and libraries to make the data cleansing and development faster. Also, R-Shiny applications are easy to implement and can be embedded in existing homepages, such as Watson. To share the code of the different elements of the solution we developed the different elements locally and shared them via Slack chat.
Reason to do so was that not all team members were acquainted with Git and GitHub. To introduce everyone on how to work with Git would extend the available time during the Sport Hackdays. When developing the machine learning model, we exchanged together in the group on what variable should be used as the predictor to determine the “best player”. With our internal knowledge about football, we decided that the market value of a player is a reliable indicator to predict the “best player”. Another discussion was the position on which a player plays. The group internal football experts were unanimous that there is a difference between market values of the players, depending on what position a player performs.
Strikers are usually the best paid and considered the most valuable performers. A lot of players play not only on one position but on different ones. That made it difficult to clearly distinguish between positions a player play. In the dataset, there were around 130 combinations of positions. We decided to declutter that information. Our football experts defined 6 possible positions and combination of positions, based on their domain knowledge. Because there were a lot of missing values for the players market value variable, we joined the second mentioned data file to this column. The second data file contained a lot more information about the players market value. To do so we did a left join but with a fuzzy join, as the names of the players were not always written in the same way. This meant that we had to clean up the merged dataset further after the join to correct errors in the fuzzy join.
To standardise the data, generate more meaningful results and have more control over the
data, we did z-transform the variables into z-scores. After the data was cleaned and ready to be further processed, we decided, that a random forest would be a fitting model to use on our data as we want to predict the players market value. This model is known to be resistant to overfitting, outliers and works also well with smaller datasets. We tired a random forest with all player positions in it as well as a model with 6 random forests, one for each position in the dataset.
While I was busy with preparing the data and train a random forest model, the colleagues were busy with creating the football player similarity analysis, which is going to be a radar plot as well as the scatterplot to compare two variables between different players. After the three elements were ready, we did implement them into our R-Shiny dashboard. Fortunately, Severin, the challenge owner from Datahouse knew R-Shiny very well and was very engaged with the implementation.
Results
After two days and one night of ideation discussions and hacking, we could present our final deliverable. We did build a prototype of a dashboard where football enthusiast can compare players with different approaches.
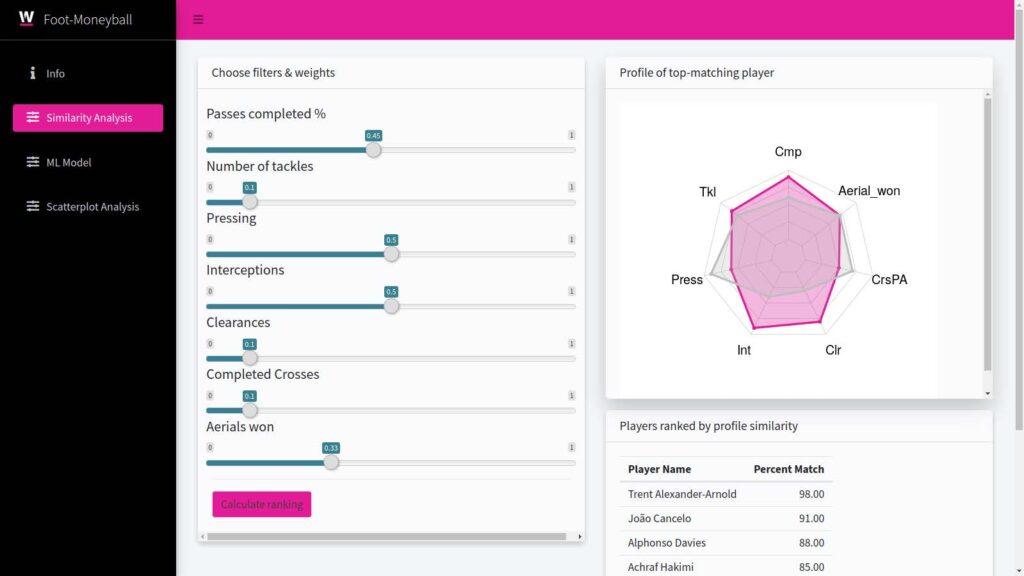
In the Figure 3: R-Shiny Football , you can see how the final solution looks. We did style the dashboard in the original Watson colours. The picture shows the similarity analysis, where two players can be compared based on different metrics. Different filters can be selected and weighted. The similarity analysis then shows a radar plot with the top matching players. The result of the second element, the machine learning approach, which was implemented as random forest, predicts the most valuable players. The model is not finally implemented but shows a tendency what variable is having the most weight for determining the market value of a player.
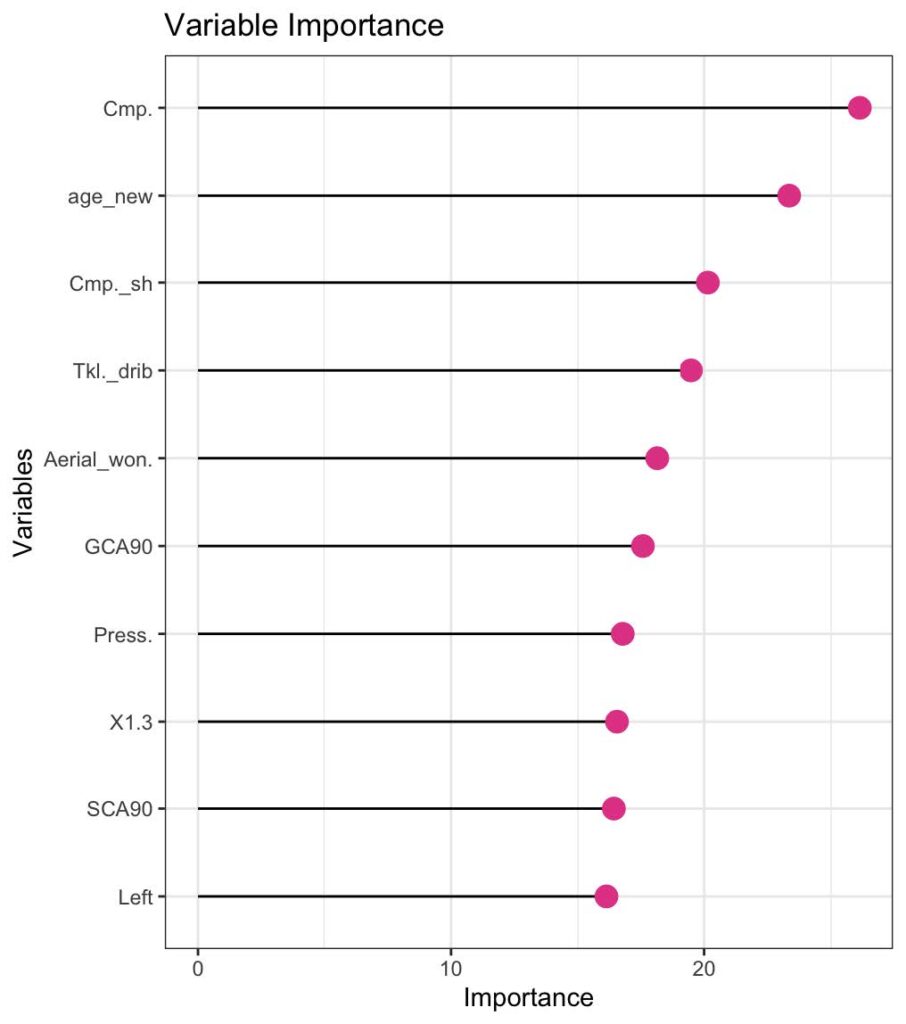
In the Figure 4: Importance Plot, one can see the top 10 most important variables to predict the market value. The most important variable „Cmp“ stands for “passes completed” and “age_new” is the players age this year (2021). The model was able to explain about 85% of the variance in the data, which is a very good result. We assumed, that the variable for the position a player plays would be very important for the model to predict the market value. Apparently, it was not. We did train 6 different random forests, for each position a player could play, one random forest. For reasons not yet known, this model performed much worse and was only able to explain around 25% of the variance in the data. This is considered a bad value and needs further investigation.
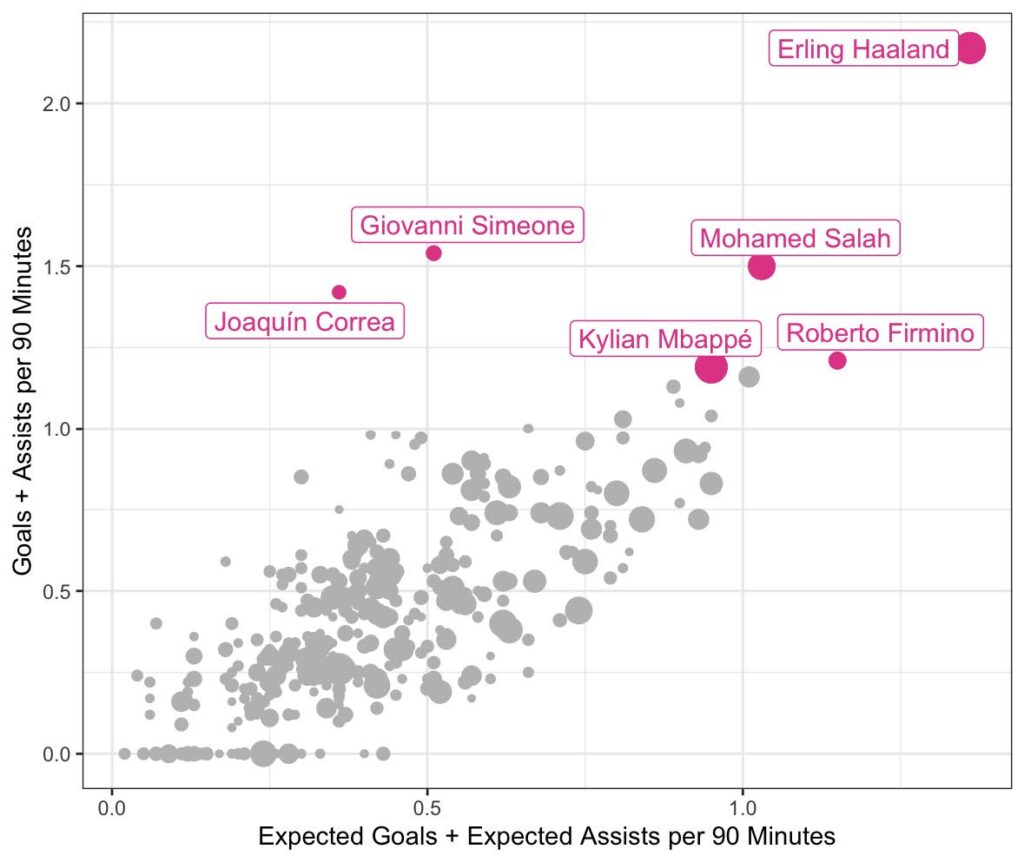
The third part on the dashboard is a scatterplot, where the user can choose two metrics, in the example in Figure 5: Scatterplot, the “Expected Goals + Expected Assists per 90 Minutes” compared to the “Goals + Assists per 90 Minutes”. The data is then plotted and some eye-catching, exceptional are highlighted. Because of the simplicity, only a few players are highlighted. Otherwise, the names would clutter the whole plot, and nothing would be readable.
Conslusion
After two long, exhausting, full of learning, joyful but also frustration tolerance testing days, I was impressed by what we have achieved. This was only possible thanks to the diverse and motivated team. Of course, the solution is not final yet and needs some more work. The difference between the random forest with all player position and the model with 6 random forests, for each position a separate random forest is a part where we would have to analyse more closely where this difference comes from. Also, the scatterplot could be developed further and more interactive, with a mouse over option to show the players’ names or a search function to find a specific player in the scatterplot.
Overall, I am very satisfied with the prototype of the dashboard, and I believe that this can give some interesting insights to a football enthusiast and attract visitors to Watson. The interdisciplinary team with students with different backgrounds, some with more and some with less knowledge in soccer as well as the strongly committed challenge owners yielded an excellent team to work with. For all the steps we did during our development process, there was someone with the right knowledge to challenge it. Eighter regarding to the data or regarding to football specific questions.
During the whole development of our solution, by far the most time-consuming process was to clean the data. This step is very essential to generate meaningful and insightful results. Good results are also characterized by the fact that they are reproducible and replicable. Therefore, we tried to document and structure the code, also during this short period of time at the Hackdays. Luckily Severin, the challenge owner from Datahouse was with us all the time. He was very dedicated to build a valuable prototype during the Hackdays. He was always available to discuss data related questions and hands on with the implementation of our solution.
For us it was a stroke of fortune to have Severin in the group. I learned a lot of how applied data sciences works. As a non-expert in football, thanks to the other colleagues in the group, I also learned a lot about the nature of football. Furthermore, I realised how important the domain knowledge about football was and it was valuable to have football enthusiasts in our group. This was best seen in the definition and elaboration of the various player positions. This can also be translated to another project. In every data science project, it is important to know the data, understand where it comes from and how it has been generated.
I was very impressed with our final solution and how far we’d come in those 2 days. To finalise and implement the solution it needs some further tuning and analysis, but I am looking forward to seeing it implemented on Watson.
Many thanks to Philipp Schaad for this very interesting article and for his commitment!

Author: Philipp Schaad (philipp.schaad@stud.hslu.ch) Master of Science in Applied Information and Data Science, Lucerne University of Applied Sciences and Arts
Challenge owner: Datahouse, Watson
Author: Philipp Schaad (philipp.schaad@stud.hslu.ch) Master of Science in Applied Information and Data Science, Lucerne University of Applied Sciences and Arts
Challenge owner: Datahouse, Watson
Info-Events
Start your career with the MSc in Applied Information and Data Science now!
Join one of our online Info-Events:
Monday, 10 August 2026 (Online, English)
Monday, 7 September 2026 (Online, German)
Monday, 5 October 2026 (Online, English)
Monday, 2 November 2026 (Online, English)
Friday, 27 November 2026 (Online, German)
Monday, 11 January 2026 (Online, English)
Programme Information | Contact | Info-Events
Interested in the MSc in Applied Information and Data Science?
Visit our Info-Events. We look forward to meeting you!
Please contact us if you have any questions about your studies:
Tel.: +41 41 228 41 30
Email: master.ids@hslu.ch
Further links to the programme:
→ Generalist profile
→ Career profiles and study insights
→ Our Lecturers
→ Course structure and modules
→ Working and studying
→ Admission and registration
→ FAQ