
Applied Data Science – Social AI: Save The Amazonas Rainforest
with Artificial Intelligence and Alexandra Strohmeier. Data Science spotlights sustainability. Data Science is on everyone's mind – be it in business, medicine or the arts – and can play a key role in solving a range of riddles. That's why Alexandra Strohmeier, a graduate from our programme, dedicated her Master's thesis to the topic of how Data Science can help us fight climate change. Or more precisely, how artificial intelligence (AI) can stop the destruction of the Amazon rainforest before it's too late. Read Alexandra's article to learn what she found, about ways of beating the clock, and other insights about what the future holds in store. Happy reading!
Table of contents & shortcuts:
Intro | Procedure | Results | Conclusion | Outlook & Future
Info-Events | Programme-Information | Contact | Professional Data Science Portraits

Alexandra Strohmeier
Former HSLU Applied Data Science student
Why the rainforest is so important for our future?
The ominous consequences of a destroyed and threatened Amazon rainforest are striking not only for the people and animals there but trigger a ripple that affects all of us worldwide. Effect: Chopping down the rainforest accelerates climate change. Cause: Nowhere else are more trees being chopped down than in the Amazon rainforest (Laurence, et al., 2002). The Amazon basin has about 60 percent of the world’s remaining rainforest – and biodiversity will suffer if human activity causes it to shrink further. The logical consequence is that the regional and global climates are thrown off balance.
The numbers speak clearly for themselves: The latest studies indicate that the rainforest currently emits more CO2 than it binds. In fact, tropical rainforests are known to absorb CO2 and play a key role in the fight against climate change. For example: The Brazilian part of the Amazon region released about 18 percent more CO2 between 2010 and 2019 than it stored. In other words, the Amazon basin released around 16.6 billion tons of CO2 into the environment but absorbed only around 13.9 tons (Thome, 2021, p.1).
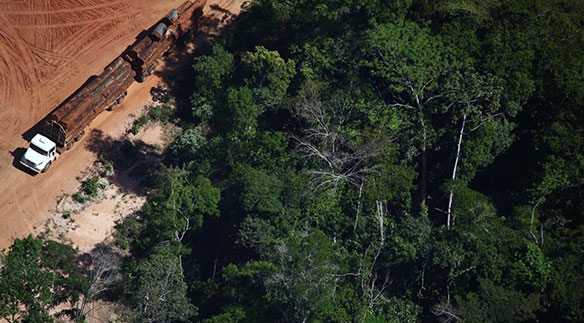
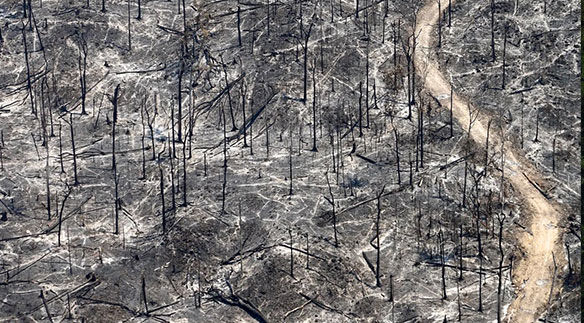
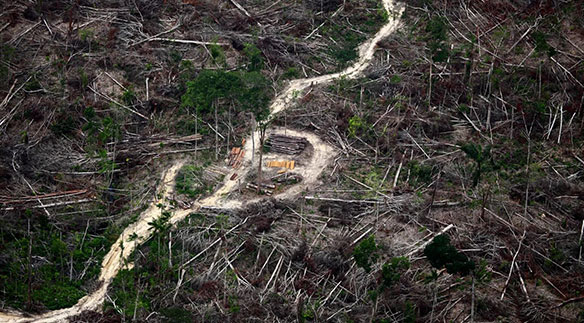
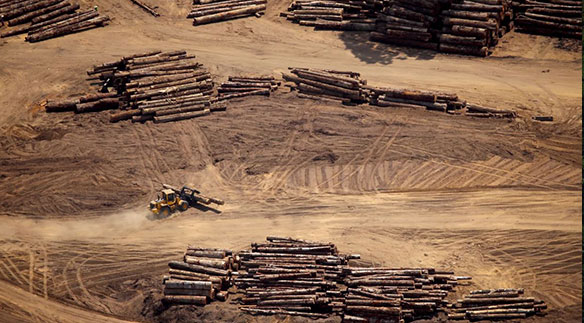
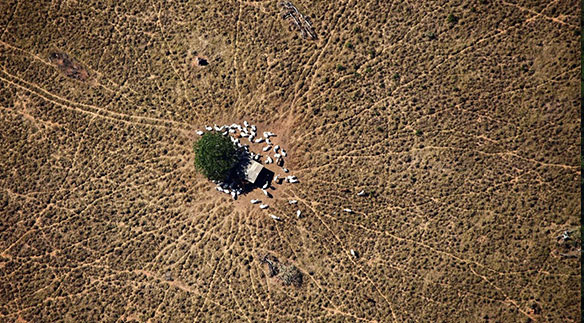
Some impressions from the deforestation of the Amazon rainforest:
AI as both a crystal ball and a protective shield
AI can add value by helping us identify risk areas in the Amazon rainforest at an early stage and thus find ways to actively counteract deforestation. This is exactly what I tried to study in detail in my Master’s thesis. I developed AI models that can play a mediator role, not only for identifying risk areas but also for visualizing potentially serious detrimental effects and predicting them, for example for the benefit of political parties looking to take preventive measures and protect the areas.
For my research, I asked myself: “How effectively can AI predict deforestation risk areas and to what extent can structured and non-structured data contribute to the overall effect?”
To answer this question, I used various deep-learning algorithms. Deep learning in turn relies on artificial neural networks that enable a computer to learn from historical data. The prerequisite for this is that the computer is “fed” with data. In my case, I used satellite imagery from Sentinel2, an Earth observation satellite of the European Union’s Copernicus programme, as well as structured data on population, socio-economic factors, crime and land use.
Predicting deforestation thanks to mixed-data neural networks
Artificial neural networks need a lot of data to ensure reliable classification, and I thus chose the largest possible area for my research, i.e. the entire Brazilian Amazon basin.
I obtained the deforestation data with the help of PRODES (Programa Despoluição de Bacias Hidrográficas), a project of the Brazilian government. I then created a model by using mixed-data neural networks consisting of a coherent combination of several neural networks. Both satellite imagery and structured data can be used simultaneously as input dimensions, so combining different data sources and data types allows for better classification.
I found some examples in my research of how deep-learning models can be used to identify the deforestation of the Amazon rainforest. The substantial difference is that my project identifies the risk areas and doesn’t just focus on deforestation per se. In other words, I focused on areas that are still intact but that could potentially be deforested.
Procedure: All good things (models in this case) come in threes
The artificial neural networks I created in my project are meant to identify those areas that are at risk of deforestation. At first, whether legal or illegal logging was taking place in the affected areas was not so important. How did I go about this?
I first used two models, namely the convolutional neural network (CNN) and the multilayer perceptron neural network (MLP) to identify the risk areas.
- First model: The MLP helped me to process the structured data and use it to predict which areas were at risk of deforestation.
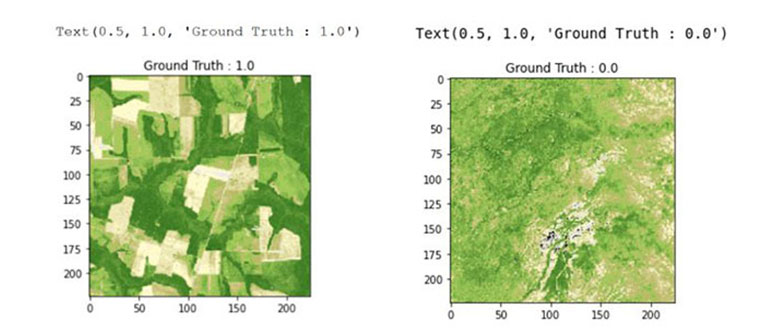
- Second model: The CNN, on the other hand, let me predict deforestation risk based on visual indicators such as satellite imagery. The unique thing here is that these images have a normalized difference vegetation index (NDVI) that measures vegetation. In other words, the CNN shows how many trees grow in a particular area.
- Third model: Finally, I combined the first two models into a single third model. With this multi-input model, which can process different data types, I wanted to achieve higher accuracy and better classification.
I used the logging data from PRODES for the labelling, which meant defining the risk areas by dividing the region in question into a grid based on the structured and unstructured data I was using. The grid is made up of cuboids corresponding to the size of the individual satellite images. A risk area is subsequently a cuboid in which the model predicts the risk of deforestation.
No project without hurdles and challenges
Preparing the data for the structured model was harder than I had anticipated. The challenge was to study the above-mentioned data sets in detail, all of which also contain a geo-component, and to convert them into a relational format.
For this, I converted the data into geopandas data frames that enabled me to aggregate and merge the datasets based on the geography (the cuboids). A tricky step, because some of the relevant data, such as on conflicts, did not have a point in every quadrant in the grid, and I thus had to use another method for those cases. For conflicts, roads, airports and so on, I took the distances into account and calculated how far apart the data points are for each quadrant.
I then assigned the labels “risk area” and “no-risk area” based on the deforestation data. This meant calculating how many square kilometers were deforested in the different quadrants by assigning the label “1” to quadrants with deforestation (risk area) and the label “0” to those without deforestation.
Results: AI looks into the future
After preparing the data, I divided it into a training data set and a test data set. The training dataset had 33,449 quadrants and the test dataset 11,148 had quadrants.
Modelling the structured data using an MLP had a 75.2% accuracy for the training dataset and a 74.9% accuracy for the test dataset. On the other hand, the visual model with satellite images had an 85% accuracy for the training data set and a 79% accuracy for the test data set. This told me that the unstructured model produced better results.
In the course of the experiment, I also frequently noticed some overfitting problems in the unstructured models, a phenomenon whereby a machine learning model excessively adjusts, or “overfits,” to the training data it knows and thus responds poorly to new, unknown data. One way to avoid the overfitting effect is to use large training data sets, for example.
A Resnet50 architecture enabled me to achieve the best results because it’s a 50-layer-deep model that can be used to train nested neural networks. In other words, I gave the Resnet50 architecture the task to recognize satellite images. I think it did a very good job and produced results quickly.
Mixed-data neural network: Special architecture for more accurate results
After validating and testing the various models, I combined them into a mixed-data version. Working with mixed-data neural networks requires several specific steps in preparing the data. For example, I had to use the special data generator functions in Keras to enter both data types. Keras is an open-source library for deep learning in Python and helps to create and train neural networks and implements special functions such as data generators, which in turn can feed data into the model.
I used the following network architecture for the mixed-data neural network with the best performance:
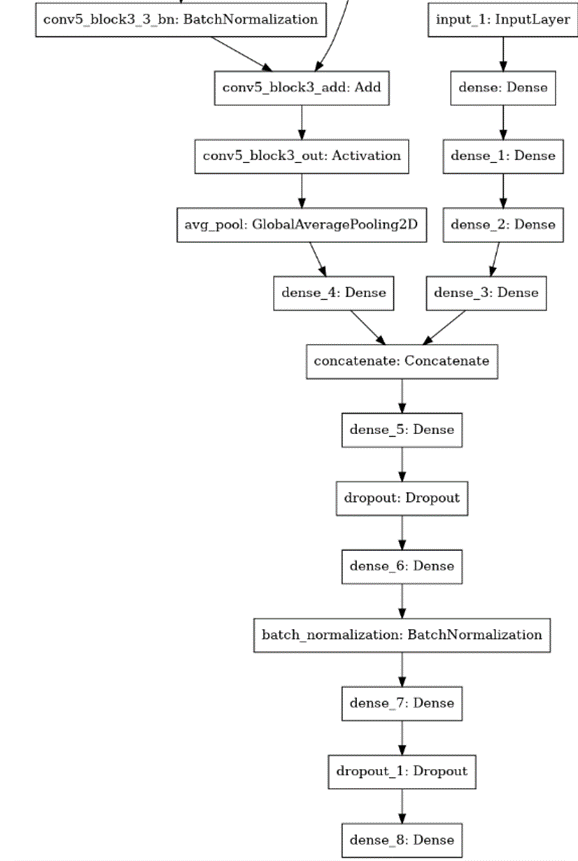
Just what exactly is this architecture all about?
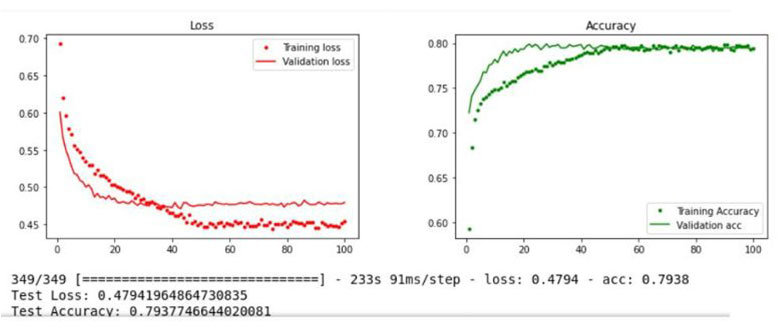
It contains the ResNet50 model from the CNN and is combined with the MLP. Furthermore, it introduces regularizations. The results of the model show a good line progression without any overfit. Both lines become more accurate in time, with validation loss decreasing steadily. The test is 79.37% accurate; training is 79.38% accurate.
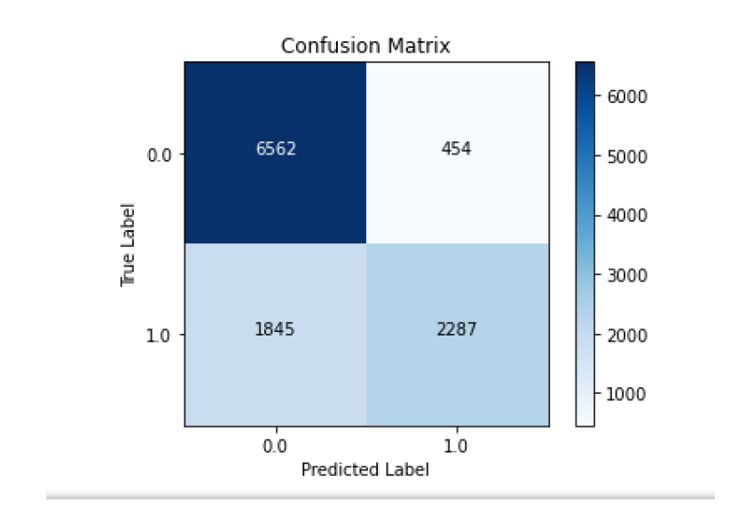
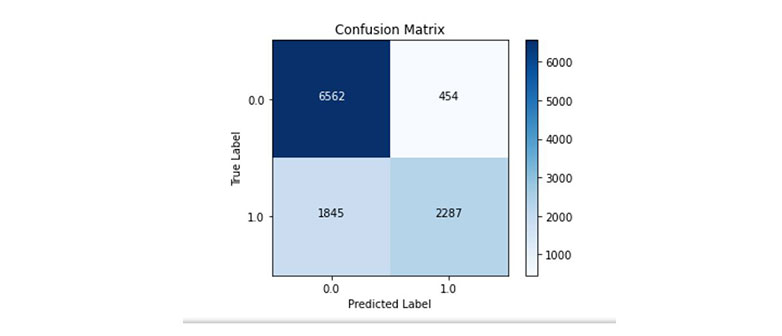
I worked with a Confusion Matrix to help me understand the performance of a model in terms of accuracy, sensitivity, and specificity. I found it to be a useful tool for assessing classification models because it gave me the number of correctly and incorrectly classified examples to decide whether the model needs improvement or is suitable for the given task.
The confusion matrix above shows that 6,562 values are “true negatives” and 2,287 are “true positives.” It produced only 454 “false negatives” and 1,845 “false positives.” For me, this combined mixed-data model clearly shows that it delivers better results than the isolated MLP and CNN models.
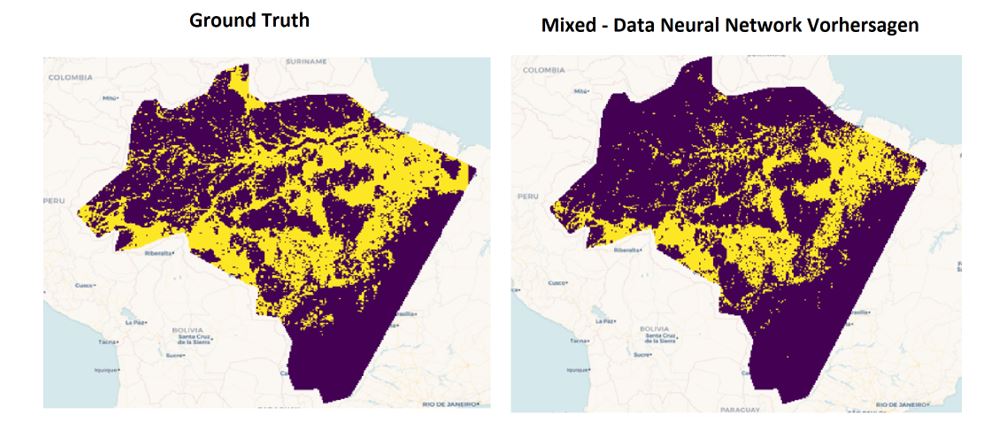
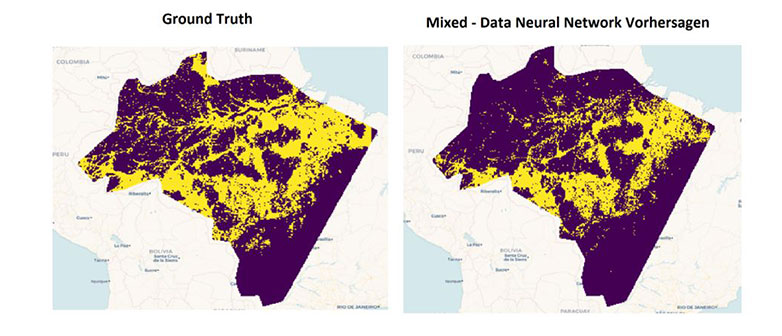
The following visualization compares the predicted and true labels and shows that the mixed-data neural network recognizes most risk areas. Only in the northwest region is the density of identified risk areas lower than for the true labels, which means there is still room for improvement.
Conclusion: AI can help save the Amazon rainforest
Visual models like CNN perform better than structured models such as the MLP. This is because already tried-and-tested network architectures such as ResNet50 were used. What I liked the most was that the combination of the different models achieved the most considerable values, thus eliminating the problem of overfitting.
In summary: The accuracy in the mixed data model was 89% for the training data set and 79% for the test data set. I can thus confirm my hypothesis that combining structured and unstructured data helps to make more accurate predictions. With AI’s help, we can anticipate the risk areas in the Amazon basin and consequently protect them from deforestation and destruction.
Outlook: Still some room for improvement
We might be led to conclude that all’s well and good. Having finished my Master’s thesis, however, I’d like to zoom out and summarize my findings as follows: Modelling naturally has its limits. And the data labelling method is not error-free by any means, on the contrary. For example, when it comes to identifying patterns in satellite imagery that could lead to deforestation based on unstructured data, CNN may produce better results.
Furthermore, it would be interesting to learn how different labelling methods affect the model quality. In this case, the model made it hard to predict deforestation, which was not yet visible in the cuboid with a deforestation label. However, I would be very interested to see how the models would change if the images were labelled so as to show deforestation in the individual images. In addition, distinguishing between legal and illegal deforestation would mean a big step forward because we could then classify the latter. And, last but not least, it is certainly important to include further structured data to identify factors other than those already known to be endangering the Amazon rainforest.
I have already thought a lot about how to proceed with the project. As a first step, I would very much like to publish the project and also make the source code accessible as an open source project. It remains exciting, more about that at a later date.
We sincerely thank Alexandra Strohmeier for the interesting insights into this fascinating project!
Authors: Alexandra Strohmeier, former HSLU Applied Information and Data Science student
Info-Events
Start your career with the MSc in Applied Information and Data Science now!
Join one of our online Info-Events:
Monday, 10 August 2026 (Online, English)
Monday, 7 September 2026 (Online, German)
Monday, 5 October 2026 (Online, English)
Monday, 2 November 2026 (Online, English)
Friday, 27 November 2026 (Online, German)
Monday, 11 January 2026 (Online, English)
Programme Information | Contact | Info-Events
Interested in the MSc in Applied Information and Data Science?
Visit our Info-Events. We look forward to meeting you!
Please contact us if you have any questions about your studies:
Tel.: +41 41 228 41 30
Email: master.ids@hslu.ch
Further links to the programme:
→ Generalist profile
→ Career profiles and study insights
→ Our Lecturers
→ Course structure and modules
→ Working and studying
→ Admission and registration
→ FAQ
Interesting articles on the topic
English articles:
The Guardian:
– Beauty and destruction: the Amazon rainforest – in pictures
– Tracking Amazon Deforestation from Above
BBC:
– Amazon Rainforest: Highest deforestation rate in six years
German articles:
National Geographic:
– Der Amazonas stößt nun mehr Treibhausgase aus, als er absorbiert
– Rekordwaldbrände im Amazonas: Vorboten der Vernichtung
– Waldverlust: Karte zeigt den schwindenden Amazonas-Regenwald
– Katastrophale Abholzung der Regenwälder schreitet fast ungebremst voran
ZDF Terra X Dokumentation:
– Die klimatische Funktion des Regenwaldes
(ZDF/TerraXPress/Christiane Mayer/Anna-Lena Neidlinger
Quelle: https://www.abenteuer-regenwald.de/wissen/folgen)


