Data Science: Hackdays Challenge – Run Against Your Predicted Time
In Switzerland, over 200'000 runners participate in around 550 running events every year. From the absolute professional runner to the hobby runner, everyone is running against themselves and, above all, against the clock. A new component should be added to this competition in the future: Betting. Every runner should be able to bet against his own time. To make this possible, the final times of each runner have to be predicted as accurately as possible.
Table of Contents – Data Science Challenge:
Introduction | Data | Development | Conclusion

Challenge owner: Datasport
Introduction
The Sport Hackdays Lucerne took place on November 27 and 28, 2021. This Applied Data Science event was organized by the 3rd and 4th semester students of the Master’s programme “Applied Information and Data Science” of the Lucerne University of Applied Sciences and Arts and was a legacy of the Winter Universiade 2021.

With the support of ThinkSport, Swiss University Sports and data innovation alliance, 11 different challenges were addressed. Our team has chosen challenge 1 from Datasport.
Datasport has been in the business of timekeeping since 1983. Through innovative ideas, speed and professionalism, Datasport has grown to become the most important IT service provider for sporting events in popular and mass sport. Datasport is now the leading provider in Switzerland and abroad. Datasport is active in timekeeping in running, cycling, multisport, winter sports, walking and serial runs, among other areas.
The goal of challenge 1 was to develop an individual betting system for long-distance races. In order to realistically estimate times to beat, Datasport needs an algorithm which predicts finishing times in endurance races. The algorithm should be adaptable to different tracks and can learn from previous races.
Data
Datasport provided data from approximately 20 different races over a 10-year period (n = 229’136). The dataset included runner-related variables such as: runner ID, country, gender, year, nationality, as well as variables related to the run itself such as type of run, altitude, distance, run ID, and final time. Further, each run itself was categorized into one of the following categories in order to facilitate comparisons between different runs: gerade, leicht steigend or Berglauf.
Development
As a first step, we needed to understand the data. To do this, we considered which variables might be relevant and which might not. The next step was to clean the dataset. Therefore we converted the run times into the same format and deleted times that came from aborted runs. In addition, we added some variables like season, month and time where the run took place. With the cleaned data set, we were able to consider which approach was most appropriate for the modeling.
We then decided to use two different approaches and compared them by the Mean Absolute Error (MAE) in seconds: a general model which takes all of the runner’s data into account regardless of parameters such as race distance or race topography and a more granular model tailored to the race distance.
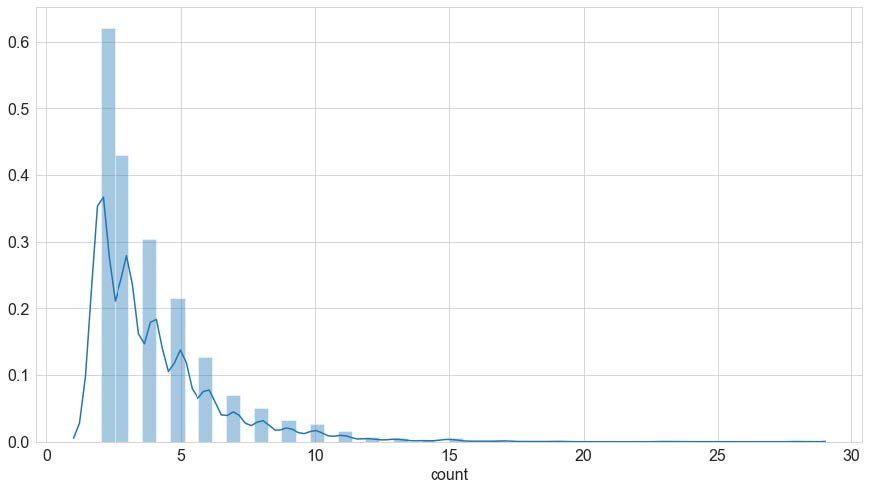
As for an individual runner the number of participated races, the race itself and the race distances varied significantly across the data set, it was pivotal to control the race distance variable and the number of participated races. For instance, the majority of the runners participated between around 2 and 7 times in races over this 10-year period which results in an unbalanced, right-skewed distribution (see figure).
Another case in point are the race distances ranging from 5 to 25 kilometers and corresponding different race time results. Thus, any model serving to predict an individual runner’s time has to control at least one of these parameters.
After tinkering around with different models ranging from simple linear regression to gradient boosting, we decided to fit a gradient boosting model for both the general approach and the model considering the race distances. Our best shot with the general model resulted in a MAE of 708.75 s (11 min 40 s) and served as a baseline. This model was based on training data consisting of runners who participated in 2 or more races. However, this error margin is clearly too high for a prediction of any sort, even for longer distances up to 25 kilometers.
The second approach intended to answer the following question: How many races a runner should have participated in for an informed prediction? To this end, we created cohorts of runners with 5,10,15,20 and 28 races of distances 5.5-21.1 kilometers, trained a linear regression as well as a gradient boosting model and compared them by the MAE metrics.
This translated into the following observations: First and foremost, the MAE could be reduced to a range between around 50 and 1000 seconds by fitting a linear regression model and between 50 and 700 seconds by using a gradient boosting model. Secondly, at least 15-20 races are required based on which a gradient boosting model is able to predict a runner’s time within a several minutes encompassing time range.
The achieved prediction errors raise the question what accuracy in time prediction is required to build a viable tool which really adds value to the experience in terms of challenge and motivation at running events. It must be stated that the models fitted yield a rather large prediction time window. Like in all sports, to beat a personal best becomes increasingly challenging as the training volume required rises exponentially and is possibly not even beatable as the personal performance threshold is reached. Thus with an increasing performance level the prediction window should decrease as well. The models currently do not account for this challenge. Therefore with an MAE of up to 1000 seconds the current solution may only serve for inexperienced runners, with rather slow finishing times which mostly depend on the form of the day.

Conclusion
In summary, we can say that with this data it is difficult to predict the finishing time accurately. There is a lack of data that differentiates one runner with another. As an example, we can take two runners who are both male, 20 years old and from Switzerland.
With our model, we predict the exact same time. However, this is very unlikely because these runners could have faced completely different conditions and show different physical constitutions. Thus, the general model is not accurate enough. If we look at the individual model we have to acknowledge that we have not enough data on a single runner. We realized that we would need about 20 runs from a single runner to make an accurate prediction. Because the performance curve among runners is very large, a tool like this relies on large and standardized data sets. One possibility is to offer this prediction tool only to runners with a certain track record or to integrate external data sources. To appeal to the masses and also with regards to the current data set it seems more realistic to enrich the data set with additional variables about the runners physical constitution.
In order to make better predictions, the profile of the runner must be improved, i.e. more data about a single runner must be available. We see a huge potential here, but information about the training level, amount of training hours, weight, height, physical condition of each runner needs to be collected. This is somewhat crucial as variability in non-professional running seems among all age classes and gender seems to be quite high. Thus the integration of the personal performance data is a central aspect of a tool like this. To make this process as seamless as possible, data could be sourced from the most popular monitoring platforms like Strava, GoogleFit, where most runners already record their performance anyway. This would enable a really personalized prediction which relies on the most current performance data and give important insight about the general fitness level with monitored heart rate and activity level.
Another aspect centers around the interpretability of a future model. Machine learning models such as gradient boosting or random forest tend to be more accurate in predictions than a regression or a classification model for instance. However, better accuracy often goes to the detriment of the model’s interpretability. The latter is pivotal for example if Datasport is keen on expanding its business model in the future also to coaching f.e. a runner of a half marathon seeks to cross a marathon’s finishing line as a next objective. In this case, some specific training suggestions based on known model variables which play an important role would come in handy.
Further it is central for Datasport to standardize their time measurement, meaning that all split times are standardized by distance. Also it is advisable to integrate an elevation model of each race held to make events more comparable. This would not only enable predictions on finishing times but rather on individual splits.
A model to predict the personal running time, could add value to Datasport and be made available to the runner within an application. We have shown how this could look like with the help of a first prototype.
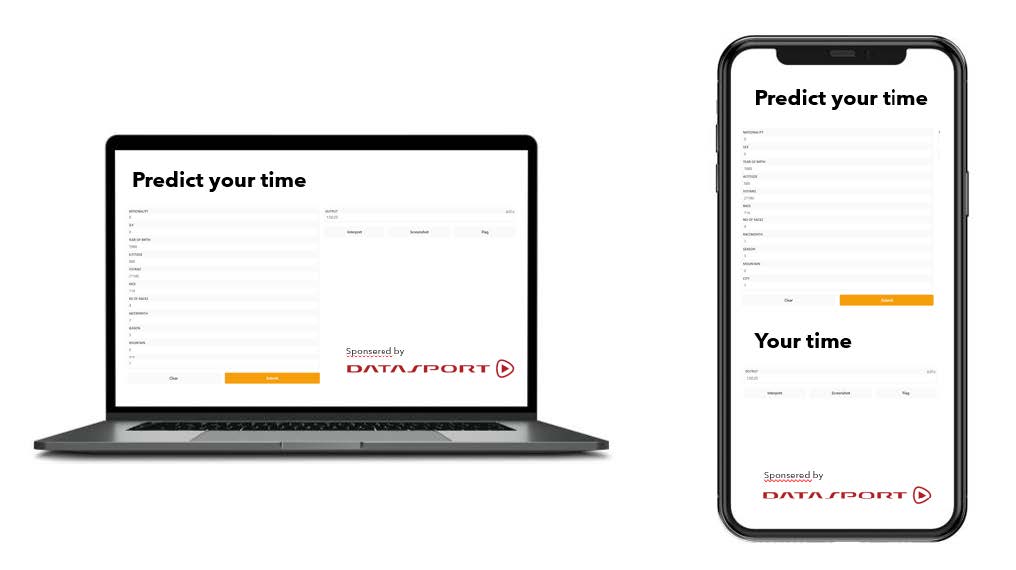
This application could be used by inexperienced runners, to set a goal for themselves or by new runners to have an indication of what they could achieve. Finally, we would like to thank all the coaches and especially Datasport for providing the data.
Many thanks to the authors: Pascal Humbel, Simon Stäubli, Mark Arnosti and Andreas Kläusli and the challenge owner Datasport for this very interesting article and for your commitment!
Info-Events
Start your career with the MSc in Applied Information and Data Science now!
Join one of our online Info-Events:
Monday, 10 August 2026 (Online, English)
Monday, 7 September 2026 (Online, German)
Monday, 5 October 2026 (Online, English)
Monday, 2 November 2026 (Online, English)
Friday, 27 November 2026 (Online, German)
Monday, 11 January 2026 (Online, English)
Home -> Applied Data Science blog
Home -> Applied Data Science programme HSLU