Sign my Bill: Social Network Analysis of the Members of the Swiss National Council
Voting day in parliament receives a lot of attention from the media and voters. But what happens inside the Swiss National Council before and after voting? Legislators need to prepare and submit their requests. To give them more political weight, they can also have their requests co-signed by other legislators. In our social network analysis we quantitatively explore who co-signed whose request in the year 2020 on individual and parliamentary group level.
Analysis of social interaction data
Up to now, the measure of co-signing a request received only little to none attention by the broad public. However, it gives interesting insights into the dynamics within the Swiss National Council:
- How diverse is the collaboration between members of the National Council?
- Do they only support requests that come from inside of their own parliamentary group (p. group)?
- Who are the legislators that manage to build bridges between p. groups?
- How does the collaboration between p. groups change based on the discussed topic?
Data Origin
To answer these questions, we collected all authors and all co-signatories for the interpellations, motions, postulates and parliamentary initiatives submitted in 2020 (n = 1026) from the website of the swiss parliament ((link: https://www.parlament.ch/en/ratsbetrieb/suche-curia-vista)) with the aid of a custom web-scraper.
Basics of Social Network Analysis
Part of social network analysis (SNA) is to study the structure of social interactions by representing them in a graph. A graph consists of actors (nodes) and how they interact with each other (edges between the nodes). In our SNA, actors are members of the National Council. They interact by co-signing the request of another member.
We used the Force Atlas 2 layout, a classic force-based, iterative algorithm that step by step draws linked nodes closer while pushing unrelated nodes farther apart. The size of the nodes represents the number of different members a member has interacted with.
To describe the network of the National Council, we looked at some key measures of SNA:
- density: How many of the possible ties to other members are present in the network?
- reciprocity: How many of these ties are mutual?
- centrality: How much is each actor “in the center” of a network?
- assortativity (of an attribute): Are two actors more likely to interact based on a certain attribute (like the p. group they belong to)?
- avg. path length: How many hops apart are two actors in a network?
Significant Differences in Co-Signing Behavior between Left and Right
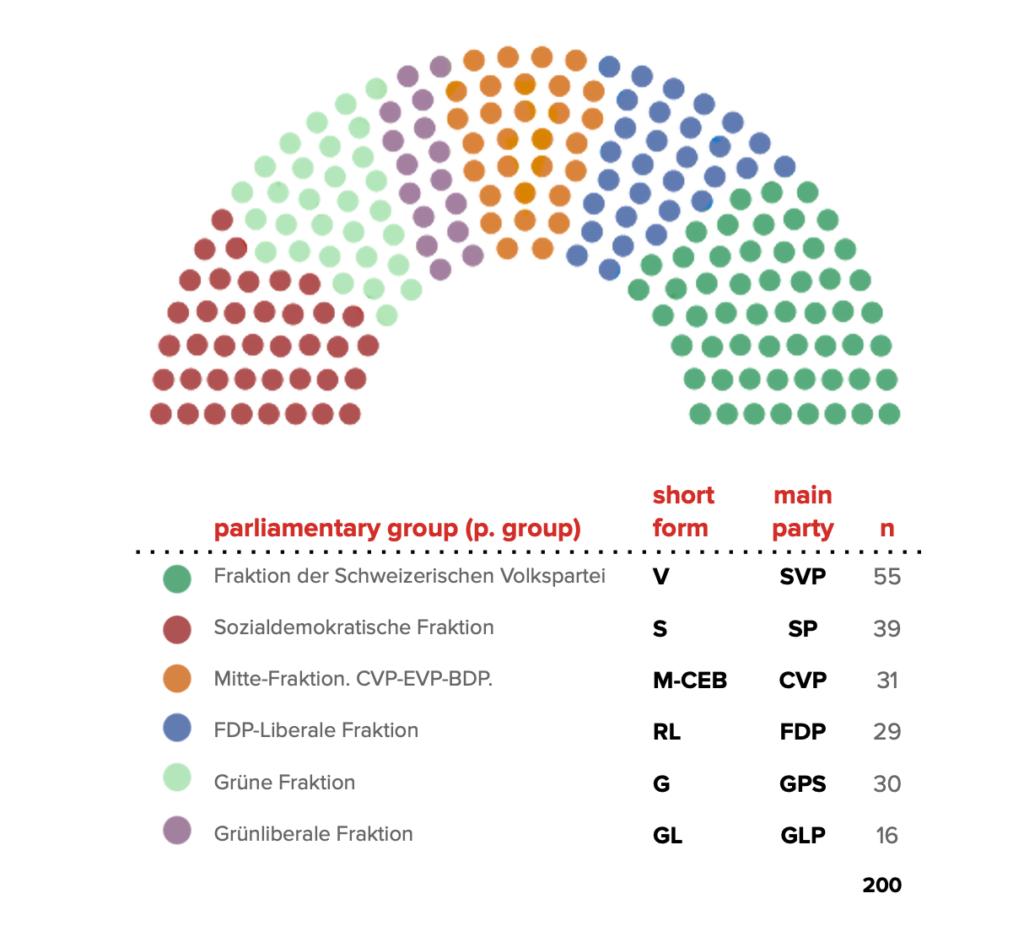
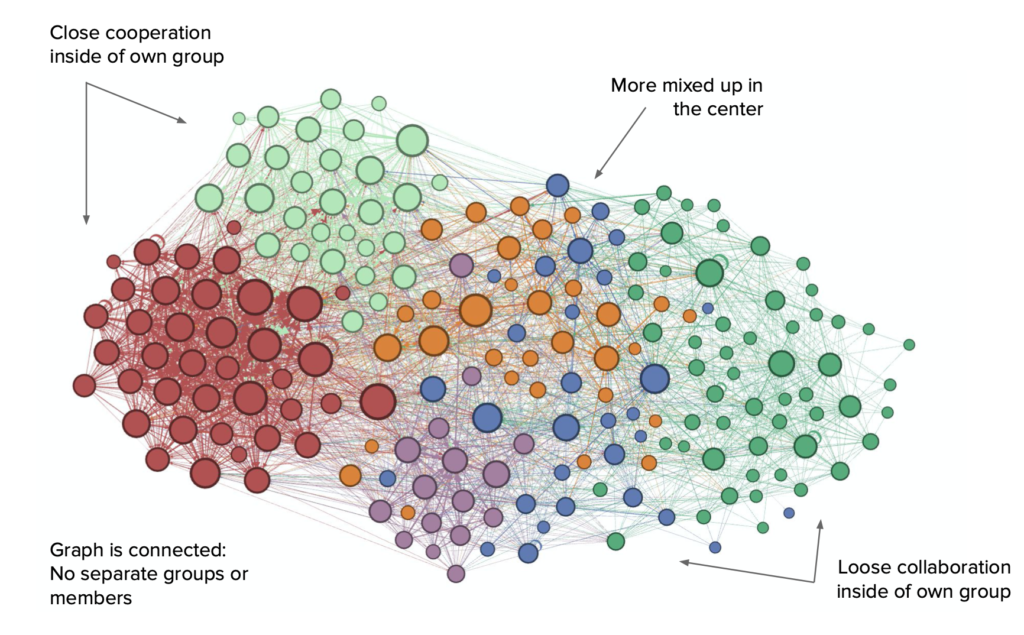
In fig. 2 we can see that the interactions between members of the National Council are highly correlated with their p. group. It can also be observed, that there are no separated members. Every member at least co-signed one other member’s request or got someone to co-sign their own request. Also no p. group as a whole is separated or located far away from the others. This suggest that there is no member and no p. group that has no or only weak ties to other p. groups when it comes to co-signing requests. The middle p. groups are indeed in the center of this graph, as we would expect it.
What is particularly striking is that the level of support within the p. groups varies a lot. In the graph, members of the Sozialdemokratische Fraktion and the Grüne Fraktion are very close to their p. group members, which shows that they cosign a very large number of requests within their p. groups. In the Fraktion der Schweizerischen Volkspartei there are seemingly more lone warriors, who are only weakly connected to the network .
Some key measures of SNA:
- density: 0.10
- Of all the possible ties that could be made, only a fraction (10%) are present in the network. In the National Council it is obvious that not all support each other.
- On average a member has interacted with a total of 20 other members (average degree).
- reciprocity: 0.43
- Slightly less than halve of the ties are mutual (43%).
- This seems to make co-signing others requests a valid strategy to get more co-signatures for the own requests.
- assortativity of the p. group: 0.44
- Which p. group a legislator belongs to plays a role to a certain extent (44%) when it comes to whose proposal they co-sign, but it’s not absolutely crucial.
- avg. path distance: 2 hops
- On average two members of the council are two hops away from each other. The longest measured path distance between two members in the National Council is 5 hops.
Cross-Party Collaborating Individuals
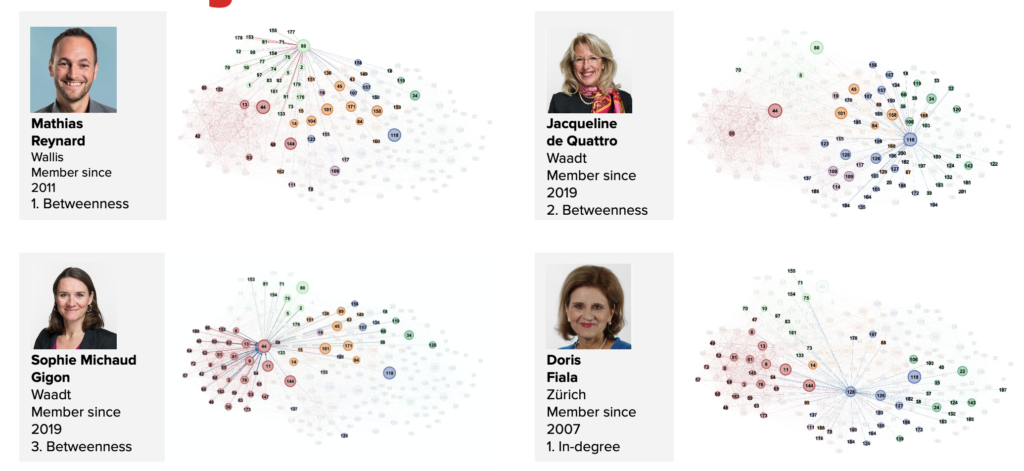
To find the essential members for cooperation across p. groups we looked at the betweenness centrality, which measures how often someone is part of the shortest path between two others.
We drew a new graph, in which the node size now depends on a member’s betweenness centrality score.
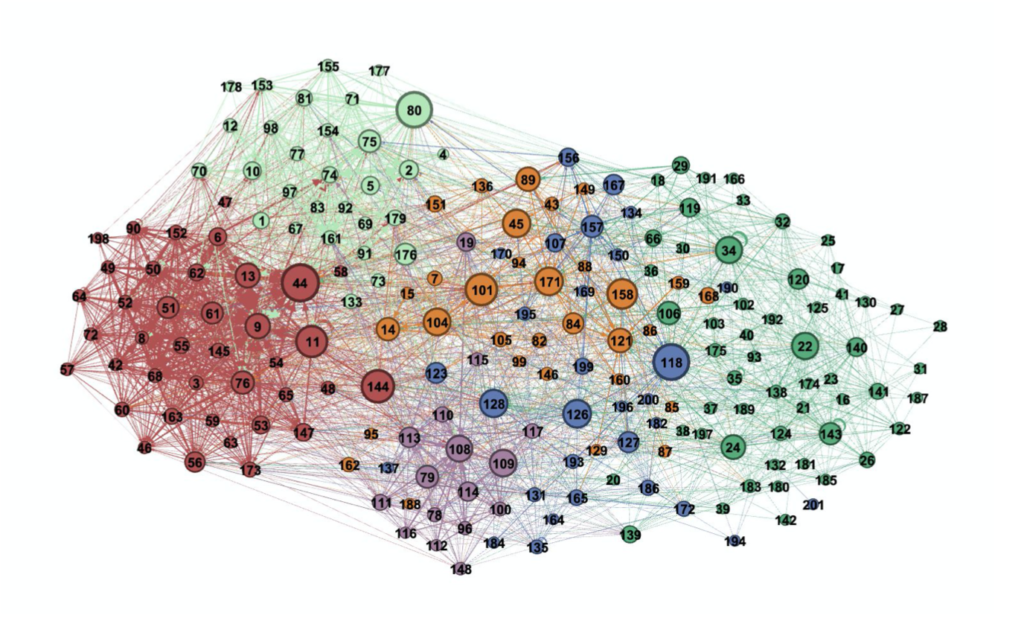
Fig. 3 shows that middle p. groups overall have a higher amount of betweenness centrality. Indeed, we would expect them to be the bridge between Left and Right. Interestingly some of the members with high betweenness centrality scores aren’t members of middle p. groups.
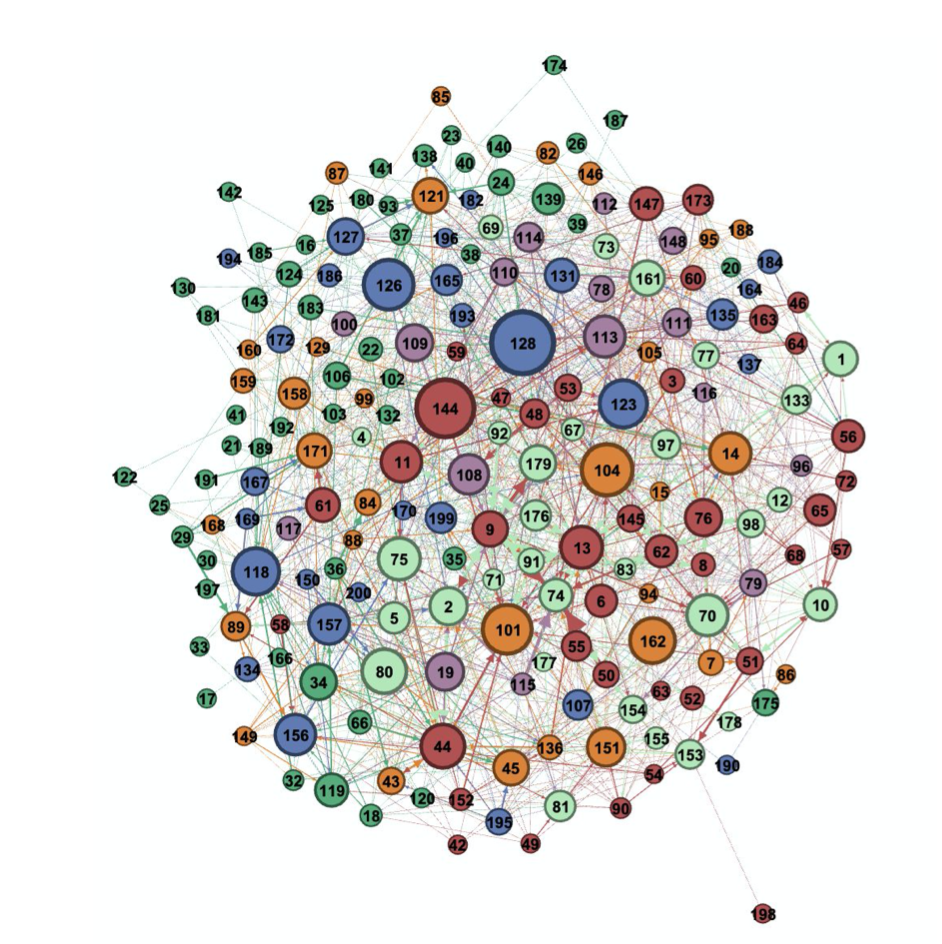
To go a little further we mask the interaction between members of the same p. group and looked exclusively at the interactions that happened between two members of different p. groups. We generated a new graph (cf. fig. 4), in which the node size represents how many co-signatures a member received. The member with the biggest node received the highest number of co-signatures for their requests from members of another p. group.
Topic at Hand is Key for Collaboration
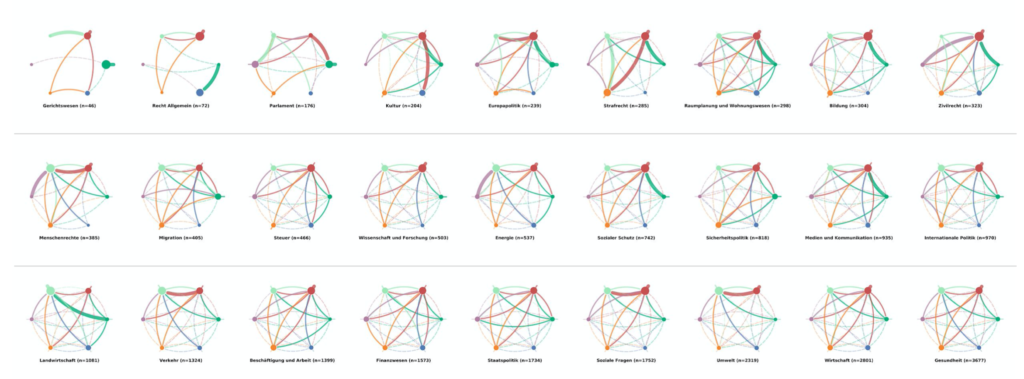
In the last step, we explore the influence of a requests topic on the level of collaboration between p. groups. Therefore, we first aggregated the data by the six p. groups for each of the 27 given topics. The different topics can be seen in fig. 7.
We used the same circular graph template for every visualization, in order to enable the viewer to make a quick and intuitive comparison between each topic. The nodes stand for the p. groups; the size of the nodes represents the amount of received co-signatures.
The edges represent the outflow of co-signatures from one p. group to another but. The outward spikes attached to the nodes represent the flow of co-signatures that stays inside the p. group. The thickness of the edge represents the power of each flow, measured as the share of co-signatures from the total share of co-signatures. A thick edge means >10% of the total share, a regular line <10%; The semi-transparent, dashed line means <2.7%. The threshold value of 0.027 was chosen, as it is the average share given a grand total of 36(=6*6) edges.
The colors of the nodes and edges match the legend in fig. 1.
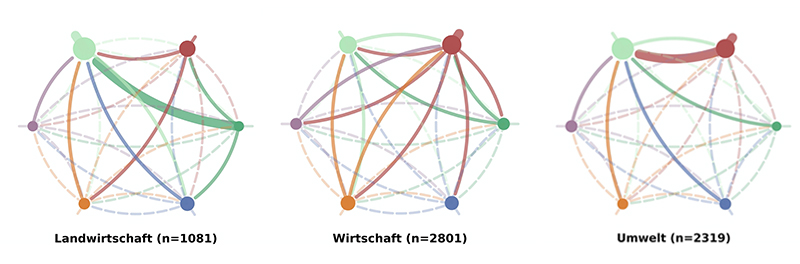
The left graph in fig. 6 shows the flow of co-signatures in the National Council regarding the topic agriculture. We can see that the flow is very concentrated towards the Grüne Fratkion. Most edges are dashed and indicate and week flow of co-signatures. The node of the Grüne Fraktion is the largest, as they receive most of the co-signatures. They also get supported disproportionately much by all the other p. groups. More than 10% of all co-signatures stem from themselves, also more than 10% of all co-signatures flow from the Fraktion der Schweizerischen Volkspartei.
As can be seen in the overview fig. 7 the amount of support each p. group receives from and provides to other p. groups is heavily dependent of the topic at hand. While for some topics the flows are rather homogeneous (e.g. economics, cf. fig. 6), other topics show a picture in favor of a single p. group (e.g. environment, cf. fig. 6).
Furthermore, it is made visible which p. group is active on which topic and collects signatures (or not). For some topics, the separation between left and right is also less apparent (e.g. economics, cf. fig. 6).
To take a closer look at the graphs and key-figures like density or reciprocity for each topic, you can access here our interactive pdf.
Authors: Marlen Stalder, Stefan Hüttenmoser
Contact us if you have any questions about the degree programme or for individual advice:
Tel.: +41 41 228 42 53 / E-mail: master.ids@hslu.ch
Info-Events
Start your career with the MSc in Applied Information and Data Science now!
Join one of our online Info-Events:
Monday, 10 August 2026 (Online, English)
Monday, 7 September 2026 (Online, German)
Monday, 5 October 2026 (Online, English)
Monday, 2 November 2026 (Online, English)
Friday, 27 November 2026 (Online, German)
Monday, 11 January 2026 (Online, English)
Programme Information | Contact | Info-Events
Interested in the MSc in Applied Information and Data Science?
Visit our Info-Events. We look forward to meeting you!
Please contact us if you have any questions about your studies:
Tel.: +41 41 228 41 30
Email: master.ids@hslu.ch
Further links to the programme:
→ Generalist profile
→ Career profiles and study insights
→ Our Lecturers
→ Course structure and modules
→ Working and studying
→ Admission and registration
→ FAQ