Professional Portrait with Michèle Odermatt: Data Analyst
With Michèle Odermatt, our former HSLU and Data Science student, we were able to portray another interesting job profile. She works as a Data Analyst at the Swiss Post (Post CH AG). Constant learning is an integral part of her life. With challenging data science projects, she and her team accompany Swiss Post on its way to digitalisation. Read more about Michèle's interesting job and everyday work life at Swiss Post below.
Michèle Odermatt Data Analyst@ Post CH Ltd.
First of all, tell us about yourself: Which hashtags describe you the best? #constantlearning, #askwhy, #justdoit, #active, #nightowl
If you like: Tell us more about them. I think there are always new things to learn – especially in data science, but of course not only. There are so many interesting and exciting things in this world, so the idea of “constant learning” will always be part of my life. In addition, there are moments when you simply have to roll up your sleeves and try things out – to just do it. Of course, we must never lose sight of what it’s ultimately about and always ask ourselves how meaningful that is. The hashtag #nightowl comes from the fact that I had to work night shifts occasionally while studying. But that was also because I wanted to keep doing sports and not neglect my family and friends while I was studying and working.
Now let’s talk about your professional life: What do you do at Swiss Post? I started at Swiss Post in Bern as a Data Analyst in May 2021. My two colleagues and I are helping the company with its digitalization efforts by focusing on data analytics and data science. This includes some smaller analyses and reports, as well as comprehensive and complex data science projects.
What did you do previously and why did you join Swiss Post? I’ve been with Swiss Post for over nine years now, right from when I started as a trainee after my Matura. Since then, I’ve been involved in some pretty exciting work – doing some consulting within the company but also creating and developing specific logistics solutions. The thing I’ve always liked about Swiss Post is that as large company it can offer you so many opportunities to develop. Moreover, it represents values that are particularly important to me, such as quality and reliability.
Tell us about the most exciting thing in your job. My job has a lot of variety that keeps me on my toes. I especially like having the chance to discuss things with colleagues from different disciplines. Achieving good project results always requires people with different backgrounds to work together closely. In addition, diversity always gives you a new perspective on things, which often is inspiring and keeps us from getting stuck in pigeon-hole thinking.
Which data science skills are especially in demand in your job? Understanding the technology is of course extremely important. But one of the key things I’ve learned so far is that as a data scientist and analyst there are always things you don’t know – which means you always have to keep learning. In other words, you need to be able to think on your feet and know how to get information quickly and easily. Soft skills are also very much in demand. By this I mean, above all, being able to deal with people and explain complex models and ideas so that anyone can understand them and that they make sense in everyday life.
Do you think of yourself more as a techie or as an analyst? Or as a creative genius, management superhero or generalist wizard? I don’t think of myself as a techie. My background in business administration puts me closer to a generalist, one with a creative streak when it comes to analyzing things. I like looking at problems from different angles and finding solid, creative solutions that work for everyone.
What do you remember the most when you look back at your studies (MSc in Applied Information and Data Science)? My first programming success was a small breakthrough for me of which I was immensely proud – even though it was only a very simple task ;-).
What are the biggest challenges in your job at the moment? Everyone is talking about data topics at the moment, and there is an incredible amount of interest in the field, with very high expectations. However, the levels of knowledge among individuals vary hugely. That’s why I think it’s important to create a common understanding and knowledge base as a starting point for projects and then to manage expectations accordingly. That’s a very tall order, one that also requires a lot of soft skills.
The question of how to prioritize projects also remains a big challenge. There are often a lot of requests and questions about projects, so I need to ask myself how do I choose the right ones and apply procedures that allow me to make objective and fair evaluations? The topic of data science itself is one of the biggest challenges because it offers so many ways to solve a problem. That makes it hard to choose the right approach, something that you can’t learn on the fly and calls for a lot of experience. It also means being able to adjust the expectations you have on oneself. As I said before, it’s impossible to know everything.
What advice would you have for others starting in the same job? Don’t give up – if you chose the program as a non-techie, you might be a bit overwhelmed at first. But that’s all the more reason to hang in there. It’s definitely worth it!
And finally: What new hashtag are you aiming for in 2021? #recommendersystem. In 2021, I plan to focus more on recommendation algorithms and their use in practice.
Many thanks to Michèle Odermatt for this revealing interview and the insights into your job and daily business.
Contact us if you have any questions about the degree programme or for individual advice: Tel.: +41 41 228 42 53 / E-mail: master.ids@hslu.ch
Event
Sports Hackdays 2021 – REGISTER NOW
Hackathons are an integral part of our master’s programme. They offer our students the opportunity to elaborate databased solutions for real-life challenges as well as to broaden their network within the Data Science community. Our annual Hackdays are a joint project of our students and external partners. For two days, our students work on exciting thematic challenges, together with challenge owners, the open data community and other external data scientists and data ideators.
REGISTER NOW for the Sports Hackdays 2021
Join us and be a part of the ground-breaking force to make sports innovation happen!
Sport was a disrupted industry before, but the pandemic has accelerated things and the sport industry has to reinvent itself to a certain point. The use of data is one key to give some sports a new face. Data allows a sport to become more accessible to a broader audience as has been demonstrated by the America’s Cup. See also our blog post.
The Sports Hackdays are a unique opportunity for sports organisations to meet the sport tech industry, data scientists, and the topic leaders “Sports Data Analytics” in order to discover how they could use data to develop their sports. On the other hand, Sportech companies can present their products and discover what data science can further get out of their data streams.
Furthermore, the Winter Universiade 2021 that is also held in Lucerne just a few weeks later (11.-21. December 2021) can be used as a showcase for newly found data solutions.
Benefits for Sports Organisations Sports organisations can meet Sportech companies that must demonstrate the usefulness of their data. And see what data scientists and universities can do with the data. They can meet data scientists that they can mandate for their specific data related challenges. The main benefit for sports organisations is that this is hands-on.
Benefits for Sports Tech Companies Sports Technology companies can demonstrate the value of their product in the most direct way and also meet the data science community as well as universities in order to understand how they can benefit from data scientists in order to understand what potential lies in their data.
Benefits for Data Science Students and other “Hackers” Sports is a growing and very attractive domain for data scientists. For most this is a unique possibility to get a feeling for this industry and proof themselves as data scientists.
Sports Hackdays powered by: ThinkSport, Swiss University Sports, data innovation alliance Sports Data Analytics Topic Leaders and the MSc in Applied Information and Data Science of the Lucerne University of Applied Sciences. Hochschule Luzern: Applied Data Science
We look forward to seeing you.
Contact us if you have any questions about the degree programme or for individual advice: Tel.: +41 41 228 42 53 / E-mail: master.ids@hslu.ch
Start your career with the MSc in Applied Information and Data Science now! Register and join us for a free online Info-Event:
Professional Portrait with Christina Sudermann: Senior Consultant
Our "soon-to-be-Graduate" HSLU and Applied Data Science student Christina Sudermann works at the KPMG Switzerland as their Senior Consultant. Our sympathetic student is always happy to face new challenges and complex projects and gratefully accepts them. That way, she sees the opportunity for herself to continuously further develop professionally and personally. Read more about Christina Sudermann's exciting professional profile as a Senior Consultant below.
Christina Sudermann Senior Consultant@ KPMG Switzerland
First of all, tell us about yourself: Which hashtags describe you the best? #openminded #dontforgettosmile #learnandgrow #dataart #kindnessiseasy #detailsmatter #booklover #staycreative #positivethinking #problemsolver #self-starting #welcomechallenges
If you like: Tell us more about them. For me it’s very important to be polite and show appreciation toward the people I’m in contact with. I therefore also believe in openness, enthusiasm and being confident about what lies ahead. And I enjoy being in an inspiring work environment, especially as part of a multidisciplinary team where I can exchange ideas about creative ways of solving problems, have constructive discussions and share the feeling of having succeeded in getting things done together. I’m also always happy to accept new challenges and to tackle complex projects, as they help me to develop personally.
Now let’s talk about your professional life: What do you do at KPMG? I work in the Multishore Tax Reporting Team, where we offer digital solutions in the field of tax compliance. This means, among other things, that we prepare country-specific tax reports to use as the basis for preparing tax returns. Furthermore, our customers can benefit from additional services of the new MTR ecosystem. My tasks are very varied and include things like developing specifications, as well as validating, manipulating and operationalizing data, all the way to working on my Master Thesis, in which I developed an automated quality assurance tool that relies on machine learning.
What did you do previously and why did you join KPMG? My first contact with KPMG was during my semester abroad. As an intern, I had the chance to work on interesting topics relating to international tax law. After graduation, I was very happy for a chance to start working directly in an agile team with a strong focus on results and long-term options in the field of taxation.
Tell us about the most exciting thing in your job. For me, the most exciting thing is being at the interface between IT and tax law. I find it fascinating to develop innovative services by combining expertise in the field of tax law with expertise in technology. In today’s tax regimes, topics such as cloud computing, digital marketplaces or cryptocurrencies are creating a steadily increasing need for skills in managing data when making definitive tax assessments. The digital transformation is generating enormous amounts of data, and I find it exciting to be in a constantly changing and dynamic environment.
Which data science skills are especially in demand in your job? A solid basic understanding of how to use data to add value is definitely one of the most important skills. Data can be used in so many ways – for example to make better decisions, design processes more efficiently, or develop entirely new services and products. It’s therefore essential to have a holistic overview of the entire data value creation process. And you need to have strong analytical skills and a knack for abstract thinking in order to deal with complex problems in a solution-oriented manner. This requires, among other things, a solid command of the skills and methods in the field of data engineering so that you can process large data quantities with very different structures, properties and quality levels.
Do you think of yourself more as a techie or as an analyst? Or as a creative genius, management superhero or generalist wizard? It’s difficult for me to make these distinctions. I tend to think of my strength as being able to recognize the qualities and characteristics that are needed in a wide range of situations and taking on the right role accordingly. At the same time, I think I’m pretty good as a generalist who is well organized and able to communicate.
What do you remember the most when you look back at your studies (MSc in Applied Information and Data Science)? The job of “data scientist” cannot be squeezed into only one definition, and the degree program therefore is geared to people from very different sectors. Especially the mix of experience and enthusiasm creates a really stimulating environment. I found it extremely enriching to have a chance to talk as equals with experts from the respective industries about the requirements and challenges in data science. And I could adjust my coursework to my individual needs. While the program gives you a solid, general foundation, it also lets you specialize in line with your individual needs.
What are the biggest challenges in your job at the moment? Bridging the difference between the technological possibilities on the one hand and the rather conservative mindset in the industry on the other is definitely one of the biggest challenges. This makes it all the more important to find the right balance and come up with innovative solutions for our customers so that they are well prepared for a digital future.
What advice would you have for others starting in the same job? Learning new things is always a personal challenge that requires courage and conviction. So, I would encourage them to seize the opportunity to try new things. Our team always welcomes new ideas, and having flat hierarchies allows us to develop them openly and assume responsibility. I also believe that we always need to stick things through and be courageous, curious and willing to learn – even when some of the challenges we’re tackling may seem beyond our reach at first.
And finally: What new hashtag are you aiming for in 2021? #daretodo I look forward to using the technologies and methods that I just learned so that I can create value for the challenges I’ll be facing in the time ahead.
Many thanks to Christina Sudermann for this revealing interview and the insights into your job and daily business!
Contact us if you have any questions about the degree programme or for individual advice: Tel.: +41 41 228 42 53 / E-mail: master.ids@hslu.ch
Deep Learning
Mirror, mirror on the wall, who’s the fairest picture of them all?
An approach to evaluate the quality of conditionally generated images of faces.
What happens when people wear masks in times of pandemics such as COVID-19? First, it helps the society in preventing the virus from further spreading. Second, it provides a feeling of protection as people feel safer when wearing masks. Third, it causes serious issues in various sections of deep learning in computer vision; specifically in the area of image detection and face recognition.
Image generation models might be a solution to the problem as facial features covered by masks can be recreated by means of deep learning. But are these models suited to this very problem? And how well do they represent the quality of the pictures? Let’s find it out with our approach to evalu-ate the quality of conditionally generated images of faces.
Previous studies discovered that wearing facial masks can cause the error rate of facial recognition algorithms to increase up to 50%. Apple’s iPhones were having issues with their Face IDs recently as people’s faces couldn’t be recognized anymore as the result of wearing masks. Parts of the face such as nose, mouth or the eyes are essential features when recognizing and detecting a person’s face in computer vision. The problem outlined above and the fact that we wanted to contribute our part against the current COVID-19 issue led us to the idea to generate missing facial features in images with the help of image generating models.
A previous project of ours in the module Deep Learning in Vision conducted by Prof. Dr. Mirko Birbaumer included the generation of facial features by Generative Adversarial Networks (GANs), where we trained a model to generate and fill missing eye areas in images. However, we hadn’t been able to quantitatively evaluate the quality of our GAN and its generated images such as the ‘reconstructed’ faces. This was reason enough to build an algorithm in order to measure the quality of generated images. Consequently, our project team decided to find an approach to evaluate the quality of conditionally generated images of faces and submit it as a research paper ‘An approach to evaluate the quality of conditionally generated images of faces’. The output of our research paper consists of an approach with which one can not only assess the quality of an image generation model and its corresponding generated images, yet also allows to measure how much a generated image adds value for image classification. The research paper has been submitted just recently and we are happy to present and outline our approach as well as some of our findings in this blog post. The following paragraphs will first introduce our GAN as it is the main source for the input images of our evaluation approach. Then, our evaluation approach, which is used to measure the quality of the images produced by our GAN, is described.
About our Generative Adversarial Network
As part of our module Deep Learning in Vision in the autumn semester 2020, we created a conditional GAN in order to generate facial parts in images, where those were missing. For example, our goal was to recreate the eye-parts of faces in images that were covered by sunglasses. In order to do so, we provided images of faces with a black bar as input for our GAN, which was previously trained on high quality face images. The aim of the GAN was then to reconstruct the eye parts in images by filling the black bar with a recreation of the eyes.
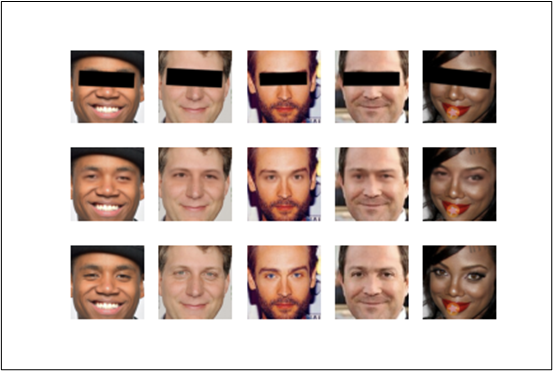
Our GAN performed relatively well after roughly 60 hours of training on our virtual machine. Some examples of reconstructed eye parts in images can be seen in figure 1 below, where in each column the image in the first row was the source image, the image in the second row the reconstructed (output) image and in the third row the original image.
The generated pictures were promising, yet at that time we had no quantitative metric in evaluating the goodness of our GAN model resp. its generated images. Therefore, we decided to find a solution on how to come up with an impartial, quantitative measure.
Inception Score and Face Recognition
Literature suggests two main scores in measuring the quality of image generation models, namely the Inception score and the Fréchet inception distance. We decided to apply the former on our model. The Inception score is an objective metric that calculates a score from a sample of images and quantifies how realistic the GAN output is. In other words, it measures how close the generated image comes to the original image. Besides the Inception score, we wanted to assess whether the face images with generated eye-parts were recognizable by means of image classification. For that, we have used the face recognition tool and its measures to identify whether faces of generated images can be identified.
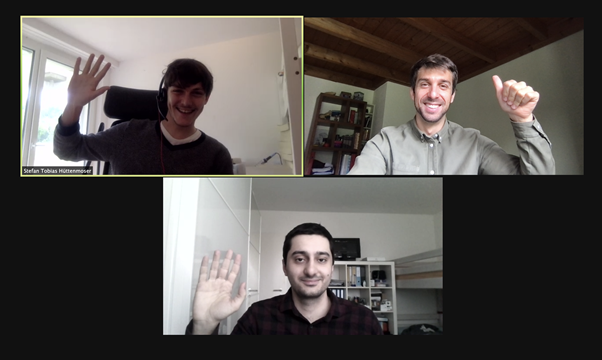
To sum up, the Inception score and face recognition score were the two underlying measures on which we built our approach to evaluate the quality of conditionally generated images of faces. Having said that, our approach contained several different work packages that needed to be tackled. Thus, we spontaneously decided to organize our own virtual hackathon during the Pentecost weekend lasting from Sunday, May 23rd to Monday, 24th 2021. Below is a picture of the three of us during a video conference call back then.
Our authors in action: Stefan Tobias Hüttenmoser, Matthias Smider & Malik Sogukoglu
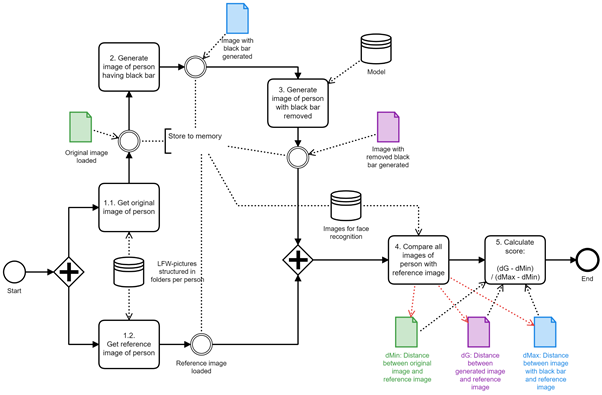
We worked mainly on two big work packages during our hackathon. One part of the team focused on applying the Inception score on our GAN and the other team was building the data pipeline for our face recognition procedure. The various working packages and the corresponding tasks were broken down into a diagram that helped the visualization and the monitoring of our project. Figure 2 below represents the process flow to calculate the face recognition score.
Figure 2: Process flow to calculate the face recognition score
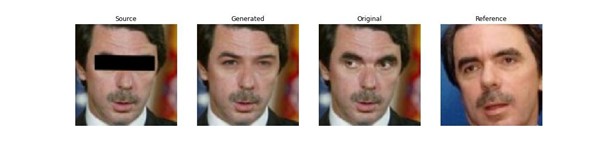
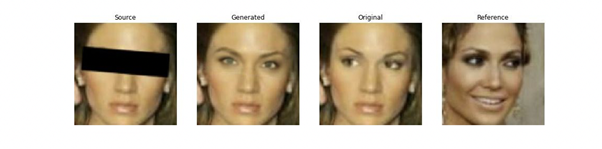
Images are taken from the Labeled Faces in the Wild (LFW) dataset. For each face detected, an original copy from the image is taken as the original image, and a second one, on which black bars are placed over the eyes as the source image (see steps 1.1 and 2; figure 2). The loaded model (in our case it was the pre-created GAN model) then tries to generate an image from the image with the bars that resembles the original one as good as possible (steps 3; figure 2).
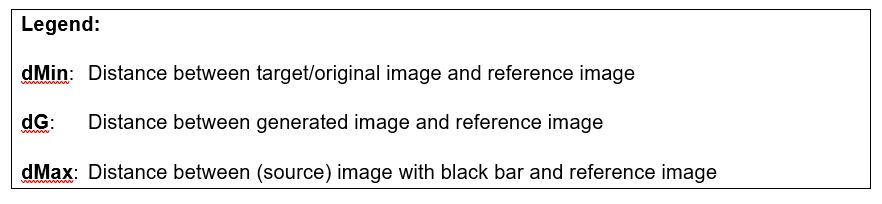
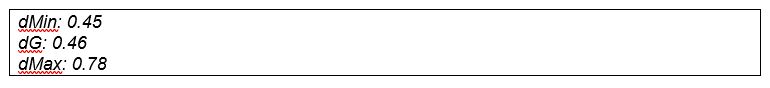
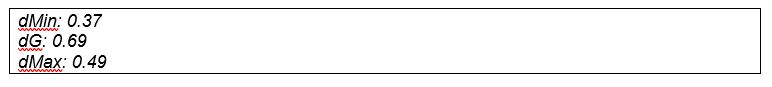
As part of the subsequent quality-evaluation of the generated image, the dissimilarity between that image and a reference image, also loaded from the LFW dataset (step 1.2; figure 2), is calculated. The reference image is simply a separate image from the same person. The dissimilarity between the generated and the reference image is indicated by a score; the lower the score, the better the quality of the generated image. To define the lowest point in the range of the possible score, the dissimilarity between the original image and reference image is measured as well. In addition, the distance between source image and reference image is calculated to determine the highest point in the range (step 4 and 5; figure 2). From the resulting three values, the final relative score of an image is drawn using the following formula:
Final relative score of a generated image = (dG – dMin) / (dMax – dMin)
Results
The following paragraph highlights the results from our evaluation approach taking the generated images from our GAN as an example. It is crucial to mention that our evaluation tool simply provides an overall state of our GAN model and thus quantifies how well our GAN model generates images – or more specifically, missing facial features in face images.
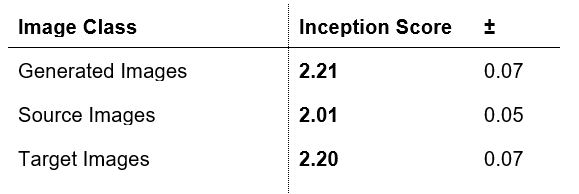
The first results from our approach to evaluate the quality of conditionally generated images are very promising from our point of view. The Inception score for our GAN and thus of the generated images is at 2.21 and therefore roughly the same as the one for our target images. Thus, this suggests that our GAN generates images that are equally diverse (have approx. the same variances) as of our target images. The difference between generated and source images is 0.2. Hence, it can be inferred that the generated images add value to the Inception score. The standard deviation is at 0.07, yet this is due to our relatively low image sample (n = 3281). Literature suggests large data samples in order to get a representable Inception score. Our dataset only provided 3281 images where image pairs of original and reference images could be gathered.
Table 1: Results of the inception-score calculation. n = 3281, LFW dataset
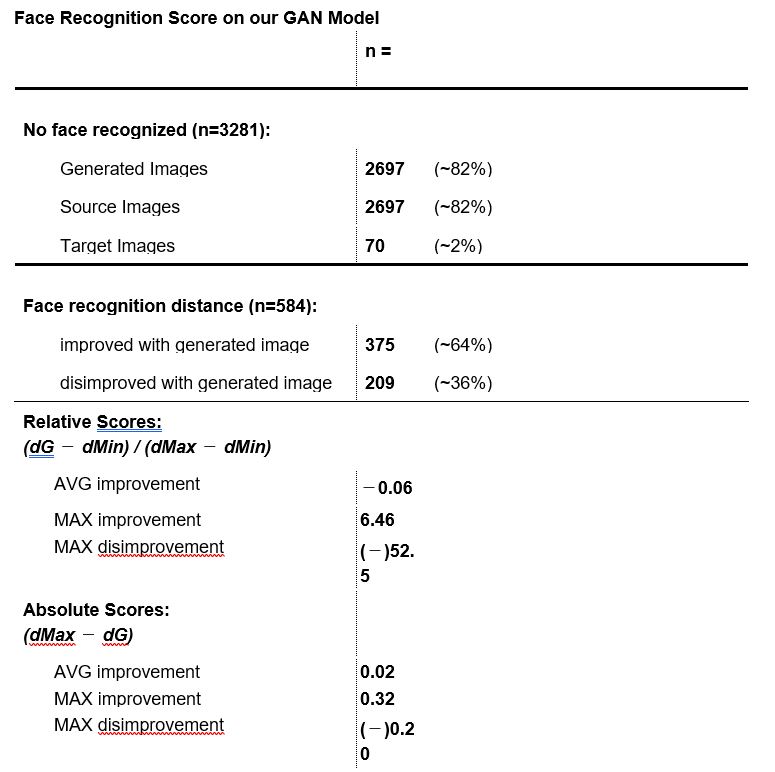
The results of the face recognition tool in table 2 provide an overall view over the quality of our GAN model and consequently its generated images according to our evaluation approach described above. Overall, the same amount in generated images and source images are recognized (18%). This rather low number states that faces in generated images are still far more difficult to detect than faces in original images. Generally, one has to acknowledge that image recognition, in particular face recognition, is a complex task. For the faces that were recognized, about two-third (375) showed an improvement whilst about one-third (209) showed a disimprovement while calculating the face recognition score. In other words: in 64% of the cases, the recognition of the face – specifically of the generated eye-parts – was improved. The rather low maximum improvement score compared with the high disimprovement of (−)52.5 states that image pairs with an already close distance between distances (dMax – dMin) perform worse in the evaluation. The Max Improvement value in the absolute scores reveal that in one case (see figure 4 below), the generated eye-parts of an image contributed to an increase of 0.32 in information and thus added-value to the face recognition. The average improvement of the absolute score over all images is positive at 0.02, which states that generated images provide overall more information to the face recognition than the source images.
Table 2: Results of the face recognition score. n = 3281, LFW dataset
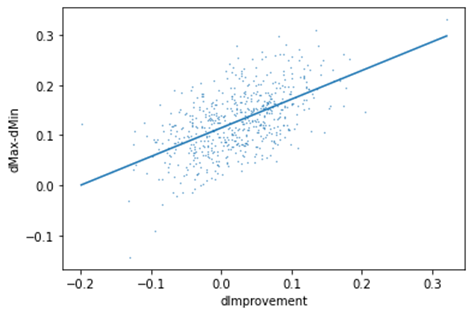
Our findings suggest a positive correlation between the dissimilarity (dMax − dMin) and the improvement (dImprovement resp. dissimilarity dMax – dG) of the face recognition (see figure 3). This implies that for original images, in which the eyes are essential for the face recognition, yet are covered by the black bar, our generated images provide a slight improvement in the face recognition. Note that the face recognition is trained on real world images. In our case however, we used images with generated facial parts (eye-parts) in it. We assume that by further training the face recognition model based on generated images, the overall accuracy can be increased and result in higher improvement.
Figure 3: Correlation between improvement and distance (dMax − dMin)
Examples
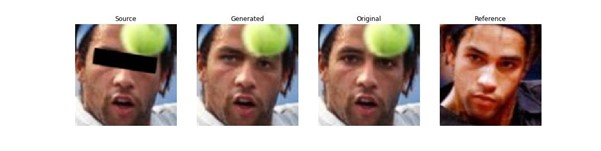
As described in the result section, some image pairs were well recognized by the face recognition tool and thus received a rather high-quality metric, whereas other image pairs could not be recognized at all. Some of the images are presented as examples below. Figure 4 for instance scored relatively well in the absolute measurement improvement metrics (dMax – dG = 0.32) as the generated eyes are similar to the original ones. Interestingly, the disturbance in the picture in form of the tennis ball did not significantly impact the eye-parts generation. Figure 5 presents an image where our GAN model generated the eyes and eyebrows differently to the original image. Thus, the face recognition tool and consequently our evaluation approach scored this as a disimprovement of 0.20. The disimprovment of 0.20 results from the dissimilarity between the dG and dMax. In that case, the difference between the generated image and the reference image (dG) was larger than the distance between source image with black bar and reference image (dMax). Figure 6 instead presents an example where a face does not get recognized from the generated image and thus receives no score. This is due to the fact that the eyes generated in the generated image point to a different direction than the eyes do in the original image (similar to figure 5) and the dissimilarity between reference image and generated image may be too high. Overall, the examples described provide proof for the importance of facial features such as the eye parts in the case of image recognition such as face detection.
Figure 4: Image pairs with the maximal absolute measured improvement (=0.32) in the face recognition metric. The generated eyes look similar to the original ones. There is an object (tennis ball) in front of the face, yet it does not significantly impact the result.
Figure 5: Image pairs with the maximal absolute measured disimprovement (=0.20) in the face recognition metric. Compared to the original image, the eyes look somewhat similar, but point in a different direction on the generated image. Furthermore, the eyebrows are much thinner on the generated image
Figure 6: This face was only recognized on the original and the reference image, but not on the source and generated image. Consequently, no scores could be calculated. The eyes on the generated image point in a different direction than on the original image
Once more we want to emphasize that the results outlined above and the examples presented are simply the quality evaluation of our GAN model and its generated images having applied our evaluation tool including the face recognition scores on it. Applying our evaluation approach on further image generation models such as further trained GANs or transformers would obviously result in different findings.
In conclusion, we are very satisfied with our project and the corresponding research paper. The aim of this paper was to build a model with which to quantitatively analyze the quality of image generation models and its generated images using face recognition as classification method. Based on the Inception score and the face recognition algorithm, we have created a tool that allows not only to validate different image generation models with each other, yet also provides a mean to quantify how much value-added a generated face image can create compared to images with missing (for example covered) facial features.
This project delivered two key insights. First, it confirmed that our evaluation approach works. Second, it provided a status quo on how well our trained GAN performs in generating distinct images. Additionally, our evaluation model further serves to assess whether generated facial features by our GAN, such as the eye-parts, can improve the correct classification in face recognition. Generally, the promising results of our GAN’s evaluation suggest that image generation models are a feasible tool to recreate missing facial features of an image and thus may be a viable option to counteract difficulties in face detection issues nowadays, where people almost everywhere wear facial masks. Finally, our approach to evaluate the quality of conditionally generated images of faces can be used as a basis for further image classification challenges and can thus be applied in various areas of computer vision.
Authors:
Students of our programme Master of Science in Applied Information and Data Science
Contact us if you have any questions about the degree programme or for individual advice: Tel.: +41 41 228 42 53 / E-mail: master.ids@hslu.ch
Start your career with the MSc in Applied Information and Data Science now! Register and join us for a free online Info-Event:
Contact us if you have any questions about the degree programme or for individual advice: Tel.: +41 41 228 42 53 / E-mail: master.ids@hslu.ch
Unkategorisiert
Professional Portrait with Patrick Sommer: Specialist in Data Analytics
Our former HSLU and Applied Data Science student Patrick Sommer works at the Valiant Bank AG as a Specialist in Data Analytics. As a goaldriven experimenter with a passion for film and music, he is professionally part of the Competence Center Data & Analytics and among other, he mainly deals with the many processes that data go through to the target systems. Find out more about his day-to-day work in his professional role.
Patrick Sommer Specialist in Data Analytics@ Valiant Bank AG
First of all, tell us about yourself: Which hashtags describe you the best? #familyperson, #experimenter, #hiking, #traveling, #musicandfilm, #ambitious, #goaldriven, #helpful
If you like: Tell us more about them. Family has always played a very important role in my life. As you can imagine, with the birth of our son last summer, my family has become even more the center of all I do. I spend most of my free time with them. Now that the days are getting longer and warmer again, I’m increasingly drawn to the outdoors, and I often go hiking and occasionally biking. If the weather causes me to turn temporarily into a couch potato, I like to indulge my passion for film and music. Or I tinker with my home electronics or PC, or with my model cars, a fascination that has stayed with me since I was a kid. For as long as I can remember I’ve had a certain pride in doing all this. It all relates to a basic attitude that has helped me reach many of my goals in my private and professional life.
Now let’s talk about your professional life: What do you do at Valiant Bank AG? I’m part of the Competence Centre of Data & Analytics where I mainly deal with the processes for handling data anywhere between the source to the target systems. In most cases, such data comes from systems within the bank and has to be aggregated and/or enriched before it can be used meaningfully in a report, for example. On the one hand I configure new loading processes, on the other hand I’m responsible for their operation and monitoring. Furthermore, I help to create and develop reports for the bank’s managers and client advisers. Our team is responsible for further developing data science in the bank, which means creating a broad, high-quality basis of data to help those who use analytical tools, thus making it possible for these very tools to be applied in other areas as well.
What did you do previously and why did you join Valiant Bank AG? I worked as an IT architect for RUAG in Bern for over four years before I joined Valiant Bank AG. It was through my work at RUAG that I became interested in data. For example, a large part of my work was devoted to looking after the architectural data, which taught me a lot about databases and managing data. During this time I realized that I wanted to develop more in this field, and I started looking for a suitable option for studying, which eventually took me to the Applied Information and Data Science program at Lucerne University of Applied Sciences and Arts. While there, I realized more and more that it’s time for me to look for a new challenge in which I can actually apply what I just learned. A fellow student at the university mentioned a vacancy at Valiant Bank AG, and a few months later I started in my new job.
Tell us about the most exciting thing in your job. My function requires me to be involved in various projects. At first glance, these tasks may often seem quite similar, but they each come with a unique challenge. We know that all roads lead to Rome, which is something I see again and again in my job. For example, there are countless ways of processing data in detail. Last but not least, the technical or data-related basis of systems can change quickly, which usually requires you to rethink things and adapt to new circumstances quickly. All this makes my job very varied and teaches me a lot, which I appreciate very much.
Which data science skills are especially in demand in your job? Data processing skills are currently in strong demand in my everyday work. This includes knowing how to connect source systems, retrieving the right data, as well as preparing and enriching such data based on what the target system needs. First and foremost, it’s essential to have a solid command of SQL, but it’s also important to be thoroughly familiar with databases and to use database jobs for exploring the options there may be in procedures and automation. In addition, being able to manage historicized data from a data warehouse well is an advantage, in addition to being good at interpreting it. That’s because there often are situations in which you have to know whether data has been processed correctly or if it reflects the wrong circumstances. Last but not least, it’s helpful to have worked with a data processing tool such as SSIS.
Do you think of yourself more as a techie or as an analyst? Or as a creative genius, management superhero or generalist wizard? I see myself basically as a generalist, but with a certain knack for technology. I find it exciting to be able to participate in the different areas in which data scientists work. Nevertheless, it is technical issues that fascinate me the most. Although I didn’t originally come from that field, I spent a lot of my free time dealing with IT topics, something that started when I built and configured my first PC by myself. This interest has led me to where I am now.
What do you remember the most when you look back at your studies (MSc in Applied Information and Data Science)? Because of my interests, I became very enthusiastic about subjects such as Python or the Big Data Lab during my studies. I enjoyed putting my heart and soul into testing new models, but I also enjoyed topics such as machine learning and computational language technologies. It’s always interesting to train a model and to then see how the results change depending on the parameters you set. What I liked most, however, was working on the Master’s thesis. I was able to work on a really exciting project involving real-time data processing. While working on it, I was able to not only expand my knowledge but also to discover a lot of new things and make valuable contacts.
What are the biggest challenges in your job at the moment? Currently, the bank has a strong need for a good basic data internally, and we regularly get new requirements for reports and new requests evaluations with very tight deadlines. This means we have to be well organized within the team and able to react appropriately if priorities change. That can be very challenging, even when we plan carefully.
What advice would you have for others starting in the same job? It pays to stick it out. Sometimes things don’t go as planned and take more time than you expected. So, be patient with yourself in such situations and keep going, because when you have overcome a challenge you’ll be all the more satisfied. But don’t be afraid to ask your team for help if you get stuck. Those who ask for support will usually also get it. And try to extend your network beyond your own department and to exchange ideas with these people. Occasionally you will find yourself having interesting discussions, ones that can help you discover solutions to problems you’re tackling.
And finally: What new hashtag are you aiming for in 2021? #gainexperience It’s been less than a year since I started working at Valiant Bank AG. So, I am still a novice in data analysis. My goal for 2021 is therefore to expand my professional experience and to learn as much as possible from my teammates, who always support me.
A big thank you to Patrick Sommer for this interesting interview and the insights into your job and daily business!
Contact us if you have any questions about the degree programme or for individual advice: Tel.: +41 41 228 42 53 / E-mail: master.ids@hslu.ch
Unkategorisiert
Professional Portrait with Lisa Becker: Controlling Professional & Data Science Specialist
With Lisa Becker, former HSLU and data science student, we were able to portray another interesting job description.
Lisa Becker works as a Controlling Professional & Data Science Specialist at Siemens. She is responsible for the development
of several databases and business intelligence systems as well she takes care and is supporting AI pilot projects. Read her interesting
insights into her daily business and Data Science studies here.
Lisa Becker Controlling Professional & Data Science Specialist
First of all, tell us about yourself: Which hashtags describe you the best? #explore #simplethings
If you like: Tell us more about them. I am always open to new things, be it a new hobby or a new method that I can use in my everyday work. I’m always happy about changes and having a chance to try things out. I always try to keep everything as simple as possible and not to complicate it unnecessarily. Complexity is something that usually comes by itself.
Now let’s talk about your professional life: What do you do at Siemens? I am responsible for developing a number of databases and business intelligence systems. I also get to work on AI pilot projects and see them through to the end.
What did you do previously and why did you join Siemens? Before I started at Siemens, I worked exclusively in the field of controlling. Today, my knowledge from the specialist area is a big help when it comes to developing data models with a financial background.
Tell us about the most exciting thing in your job. I’m in contact with all kinds of people from many different departments. Siemens also gives me a lot of freedom when it comes to developing new things, and I can try things out and be creative. Of course, not every idea ultimately works, but that’s part of the fun.
Which data science skills are especially in demand in your job? Communication is enormously important, in addition to technical knowledge. Most stakeholders don’t have a technical background and understanding their needs and coming up with solutions correctly is often a challenge. On the other hand, you have to be sensitive when explaining technical problems in order to convince also those stakeholders who are not computer scientists. Having a solid grasp of organizations and project management is also an advantage. In everyday work, data projects tend to run in parallel. So, maintaining an overview and identifying or adjusting priorities at the right moment can make a world of difference.
Do you think of yourself more as a techie or as an analyst? Or as a creative genius, management superhero or generalist wizard? I think I would describe myself as a generalist. My strength lies in being able to efficiently analyze problems and quickly familiarize myself with new topics. I see this as a great advantage, especially in the field of data science, where each project is likely to be unique.
What do you remember the most when you look back at your studies (MSc in Applied Information and Data Science)? I am particularly excited about the range of options that data science offers. It’s a field that is constantly developing. I keep coming across new methods and tools that I had never heard of before but that can be applied in many ways.
What are the biggest challenges in your job at the moment? For me, the biggest challenge is to keep cool when things get hectic. You should never underestimate the number of projects and the many different stakeholders you may be dealing with. It’s not always easy to stay calm and keep an overview of all that’s going on.
What advice would you have for others starting in the same job? Try out new things and don’t let failures get you down.
And finally: What new hashtag are you aiming for in 2021? #backtobasics In our studies we covered many technologies and methods, some of which I can already use in my everyday work at Siemens. In 2021, I would like to try out some additional skills from the data science toolbox.
Many thanks to Lisa Becker for this informative interview and interesting insights into your job!
Contact us if you have any questions about the degree programme or for individual advice: Tel.: +41 41 228 42 53 / E-mail: master.ids@hslu.ch
Start your career with the MSc in Applied Information and Data Science now! Register and join us for a free online Info-Event:
Hardly any other industry uses a broader range of data sets in its analyses than journalism. Every day, writers tackle new themes by presenting an overview and preparing their opinions and findings for their readers. And in doing so, they rely on just about the entire range of analytical tools covered in the Applied Information and Data Science programme at HSLU.
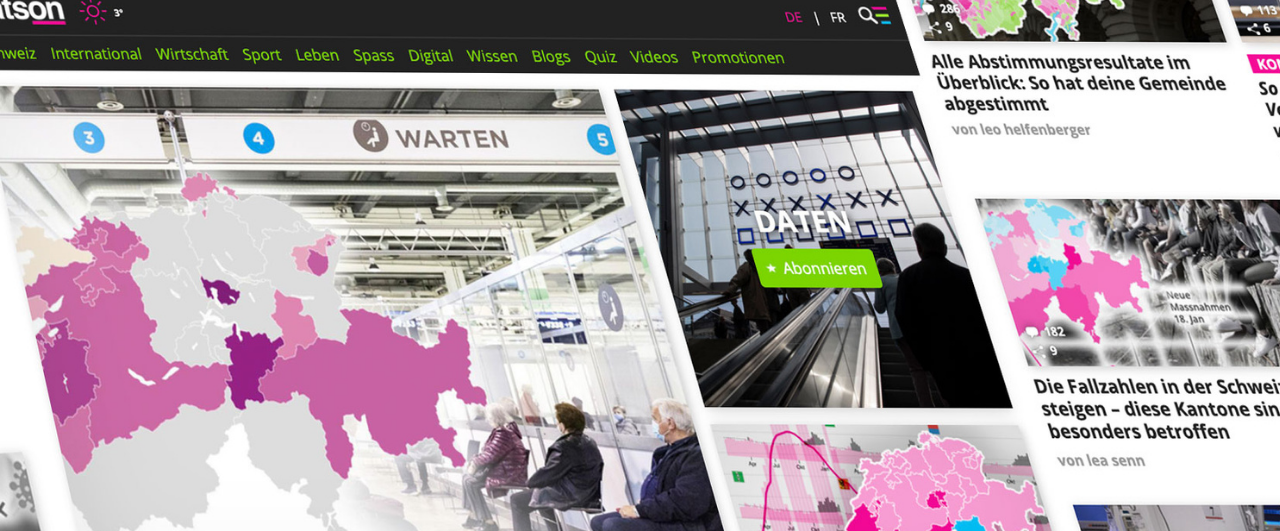
I have been working as a data journalist for the online-only news portal watson.ch for four years. In a small team, we collect and analyze data and then prepare it graphically. We often base the ideas for articles on current events and try to shed light on the perennial issues that many people tend to be thinking about. In this blog article, I would like to give you a brief insight into how we work – in the form of an insider’s view of three articles.
1. Research
Data sets are often readily available – for example, from the website of the Federal Statistical Office or by contacting someone at a company’s media office. However, for techies things become more interesting when the data must first be scraped from a source.
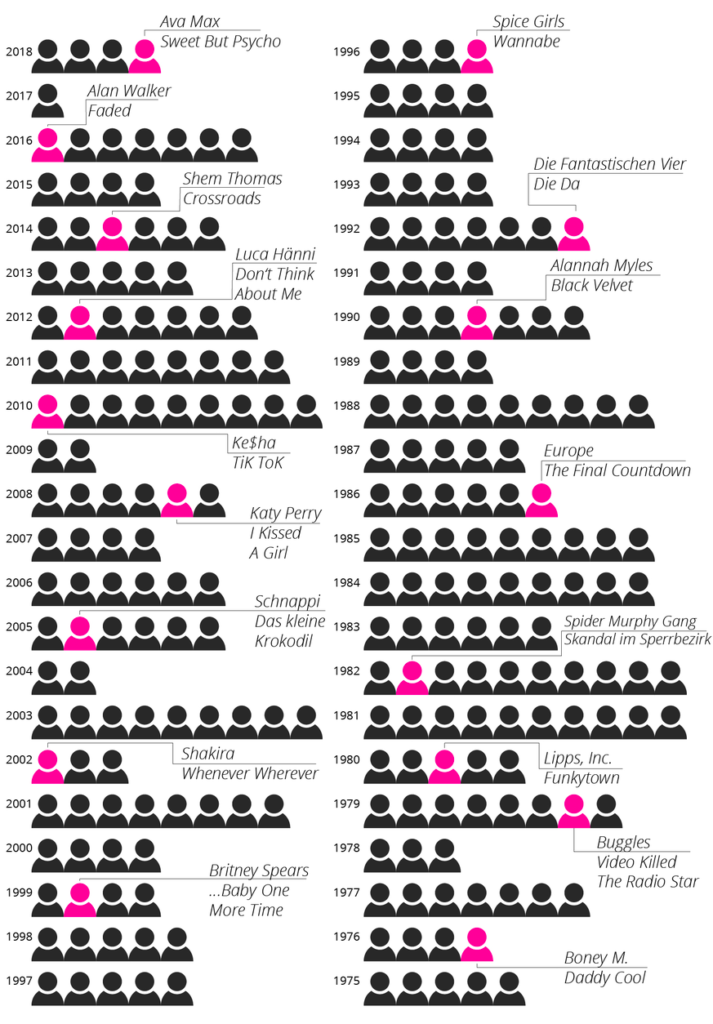
For example, after the meteoric rise of singer Ava Max with her song “Sweet But Psycho” in 2018 we wanted to know just how often a no-name performer has managed to land a number 1 hit on the Swiss charts out of nowhere. We didn’t have an exact data set, but the weekly hit charts are on the website https://hitparade.ch/charts/singles, which has lists dating all the way back to 1968. We thus used a Python program to retrieve the top 100 hits of each week and then stored the songs, including the artist, in a table.
The main sticking point in data cleansing involved modelling of the data structure around the performers because some of them appear in various combinations in the charts. For example, connecting the success of “Ritschi” as a solo artist with his role as the lead singer of the band “Plüsch” is impossible unless you know that he has both roles. Some artists, such as “Remady & Manu-L,” often perform as a duo, but they sometimes also perform separately. Does this mean you should include them as joint or as individual performers in the analysis? Not least due to time constraints, we did not evaluate artists separately when they collaborated with others but talked with music experts instead, who told us that difference is of hardly any consequence for our research.
Our analysis later showed that Ava Max became the fourth female artist in 2018 to climb to the top of the charts in five weeks or less, and this after never having been on any chart before. The following graph shows that the same phenomenon happened at times previously. Some well-known artists are highlighted in magenta to make the findings easier for the reader to grasp.
While we often get an overview of simpler data sets directly by using Excel or Google Sheets, Python comes in handy when working on larger or more complex data sets. We used a Jupyer notebook to document our steps because this has the great advantage of enabling us to use the code again later with a new dataset, making it possible to update or republish an article within minutes.
This advantage proved useful also during the Corona pandemic, for example when entering the latest data on case numbers, deaths, hospitalizations and vaccinations, etc. in Switzerland via an interface from the Federal Office of Public Health. In some cases, it may still be necessary to calculate the average values over one or two weeks from the data. And the date column may still need to be adjusted, depending on the data source. For example, only the calendar week appeared, which meant first having to convert it with Pandas before being able to process it.
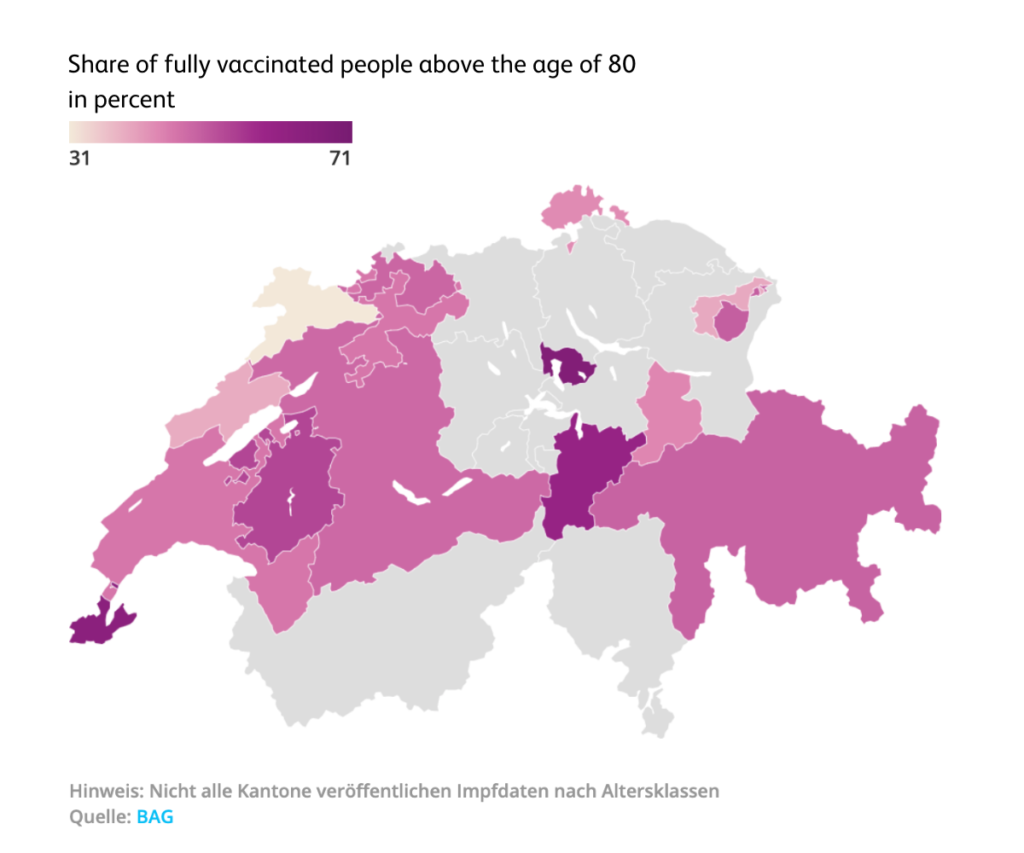
We may also need to be able to combine different data sets. This allows us to answer the most pressing questions and present the findings visually with just a few lines of code. For example, at the beginning of April 2021, we calculated the percentage of fully vaccinated people above the age of 80. From the visual analysis we could see that the cantons of Zug, Geneva and Uri were already way ahead, having vaccinated well over half of its octogenarians at that time.
Note: Not all cantons publish their vaccination data by age group / Source: Federal Office of Public Health
Once we have extracted the insights from the data, we face the most challenging task when we ask ourselves what’s the most intuitive way to convey the information to the reader. After all, we know from experience that digital attention spans tend to be short these days. 🙂
So, when visualizing content, it’s often necessary to make a lot of sketches and drafts before we finally arrive at a satisfactory result. And it makes good sense to ask other journalists for their ideas and to study readers’ comments once the article is published.
For example, an article about the collapse of air traffic at Zurich Airport during the global pandemic required a lot of drafts. In the Domain Experience module on Geospatial Data Analysis for Smart Communities we learned how to use the QGIS geoinformation software. As the open-source tool, it helped us to import the modified data sets we received from Zurich Airport and create monthly graphs on the destinations served. When compiled sequentially in a GIF, the data shows how air traffic plummeted during this time.
London, the most popular destination in pre-Corona times, was particularly affected: In April 2020, there were just 59 flights to and from the UK capital, compared to 1,390 in January 2020.
You can find the full article here as well in case the animation would not work: https://www.watson.ch/schweiz/reisen/337021110-wie-sich-der-flugverkehr-aufgrund-der-pandemie-bis-heute-veraendert-hat
4. Publication and Analysis
As you can imagine, our data-driven journey doesn’t end here. We use A/B testing to find the best title and web tracking to analyze visitor numbers, and we then think of ways to incorporate what we learned into future articles. For more data-driven stories from watson, visit http://watson.ch/Daten.
Contact us if you have any questions about the degree programme or for individual advice: Tel.: +41 41 228 42 53 / E-mail: master.ids@hslu.ch
Unkategorisiert
Professional Portrait with Philippe Walliser: Data Science Consultant
Our former HSLU and Applied Data Science student Philippe Walliser works at PwC as a Data Scientist Consultant in the data analytics team. His passion is programming and extracting knowledge from large data sets. Read more about everyday data science work and the review of Philippe's studies here.
Philippe Walliser Data Science ConsultantatPwC Switzerland
First of all, tell us about yourself: Which hashtags describe you the best? #curious, #learning, #analytics, #exploring, #building, #coding, #cloud, #icedcoffee
If you like: Tell us more about them. I basically think of myself as someone who is permanently curious. Even as a small child, I was interested in how things work – anything I got my hands on. With this attitude, learning comes naturally. But in recent years I’ve developed a passion for programming. In particular, I love trawling through large data sets to discover things or writing small programs that automate certain functions. But I also love to develop and improve models for classifications or regressions. I’m convinced that cloud technologies will become more and more important over time, and I’m fascinated by the opportunities they offer. That’s why I made it a priority to learn more in this field, alongside my job and studies. The last hashtag simply refers to the fact that I drink too much coffee with ice cubes.
Now let’s talk about your professional life: What do you do at PwC Switzerland? I work as a Data Analytics Consultant. The data analytics team at PwC has grown a lot in recent years and is now one of the largest in Switzerland. We have projects and competencies in almost all areas of data science – ranging from technically implementing AI solutions all the way to classical management consulting on data strategies of global companies. I myself am currently working on a major cloud project for an international asset manager.
What did you do before that and why did you join PwC Switzerland? I worked as a data science intern at Roche for around one and a half years. There, I had a chance to be part of some exciting projects and meet some great people. I worked in an R&D team on a data platform for blood measurement devices for six months before moving on to the data analytics team, where I worked on a large demand-forecasting project. I changed to PwC is because I wanted to learn more about consulting for a certain period. PwC allows me to get involved in various projects and thus to develop myself further. And PwC is a place that puts a strong emphasis on continuous learning. As an employee, I have ten days a year for further education, which is a very important aspect for me.
Tell us about the most exciting thing in your job. I think that being involved in such a variety of projects is what makes the difference. With this I mean not only the breadth of content from the various technologies that are used but also the range of industries that I can learn about in a relatively short time. In some cases, a large part of a project may take place abroad, thus adding a larger geographical dimension to the experience. All this becomes possible only in the field of consulting.
Which data science skills are especially in demand in your job? It depends a little. In my job, there are generalists as well as specialists. In other words, there are consultants who deal almost exclusively with NLP projects, while others work on many different projects and technologies and then decide on a certain niche only at a later stage. In general, I would say that being able to learn quickly and having good communication skills will make the difference. Projects can be pretty fast-paced, and you sometimes have to learn a new technology very quickly. Communication skills are especially important not only because you have to present all deliverables to your clients but also because consulting is a team sport (like so many things nowadays) where things have to work smoothly and where being able to convince others – especially clients – is essential for survival.
Do you think of yourself more as a techie or as an analyst? Or as a creative genius, management superhero or generalist wizard? I think that my CV indicates that I’m more of a generalist. I did my Bachelor’s degree in Business & Economics and only then completed a technical Master’s degree. There are certainly many advantages to having both a technical and a business perspective, but basically my goal is to develop my technical skills.
What do you remember the most when you look back at your studies (MSc in Applied Information and Data Science)? This degree program allowed me to do and learn what I enjoy the most almost daily for a good two years. In particular, some of the projects I worked on stand out in my memory. For example, there was a challenge in which we all received the hourly sales figures of a restaurant in Zurich and then had to predict the daily sales figures as accurately as possible for the next 100 days. Challenges like this gave me an incredible boost and made me try out all kinds of different things.
You quickly learn that acquiring analytical and technical skills mostly involves actually working on real-life examples. Another aspect that will always stay with me is all the great fellow students whom I got to know during my studies and the friendships we developed.
What are the biggest challenges in your job at the moment? The diversity mentioned earlier can be both a curse and a blessing. But you also have to get used to new situations quickly and be able to learn new technologies in real time. Furthermore, eight hours won’t be enough to complete certain tasks on certain days.
What advice would you have for others starting in the same job? I would advise them not to get intimidated. And another thing, as a data scientist you have to realize that your education is far from finished when you get a Master’s degree. The field is always evolving, and current technologies are constantly being replaced by new ones. In conclusion, however, I would say that above all you can always count on the help and experience of your fellow human beings.
And finally: What new hashtag are you aiming for in 2021? This year, my main goal is to learn more about cloud computing. Specifically, I want to get more involved with #CloudArchitectures and become more of an expert in this area.
Contact us if you have any questions about the degree programme or for individual advice: Tel.: +41 41 228 42 53 / E-mail: master.ids@hslu.ch
Unkategorisiert
Professional Portrait – Chief Digital Officer with Maurice Willen
Our former HSLU and data science student Maurice Willen works at Connect Com in the position of Chief Digital Officer (CDO), as well as Head of Strategic and Operational Project Management and Head of Innovation Management. As we know, he is driven by ambitious goals and his pioneering spirit. His core tasks include the development and implementation of the digital strategy and the evolution of operational and cultural change. In the following field report, he tells us what exactly excites and fascinates him in his daily work.
Maurice Willen Chief Digital Officer at Connect Com
First of all, tell us about yourself: Which hashtags describe you the best? #valuecreator #pioneer #creativity #uniquestyle #focus
If you like: Tell us more about them. I find ambitious goals to be exciting. And I like thinking about ways to anticipate the future. I had this already as a kid. Basically, I’ve always been interested in new and unconventional ways of getting ahead and motivating those around me. I believe that success comes naturally when you create value for others. For me, creativity means finding ways of combining basic concepts in order to develop new ones that are of greater value. In simplified terms: Creativity means finding new ways to combine existing solutions. I sometimes have pretty unconventional ways of doing things that can puzzle those who don’t yet know me. But I’ve developed ways for coping in such situations. By now, I can also count on the help of others around me, and together we’ve become pretty good at reaching our goals faster. Although it might sometimes look like I have too many irons in the fire, I’m not a multi-tasker by any means. Multi-tasking is a myth for me – whenever possible, I try to eliminate distractions from my daily routine and focus on one thing only, get it done and move on to the next.
Now let’s talk about your professional life: What do you do at Connect Com? I have three functions at Connect Com. I’m the – Chief Digital Officer (CDO) – Head of Strategic and Operational Project Management – Head of Innovation Management
This gives me a clear focus on the areas where we can add value, increase efficiency, and professionalize. Other core tasks include developing and implementing our digital strategy and promoting operational and cultural change.
What did you do previously and why did you join Connect Com? Originally, I did an apprenticeship as an electrician. Over the last few years, though, I continuously learned and developed my skills in my field. The relationship with Connect Com began on 24 December 2012. While doing some last-minute Christmas shopping at Globus in Lucerne, I bumped into someone who was working at Connect Com then and who is now my colleague. As a result, I had my first day at Connect Com on 1 March 2013.
But what is Connect Com anyway and what made me change? Well, Connect Com (CCM) is a leading producer and provider of data communication solutions. We offer a comprehensive range of fiber optic products – over 80,000 items – and are mainly active in broadband, mobile, CATV, telecom, FTTx, data centers, manufacturing, and communication cabling. However, it was clearly the corporate culture there that convinced me to change. The respect, appreciation and honesty of the people there, plus their willingness to change and their courage to question things that worked in the past, are values that make for an exceptional working atmosphere.
Tell us about the most exciting thing in your job. I believe that digitalization will be one of the most exciting and defining strategic issues of the coming decades. Entire business ecosystems are being revamped step by step, something that completely changes the way we work and communicate. The coolest thing is to see how methods and systems establish themselves in organizations within a very short time – things that become indispensable even after just a few months. Of course, it all becomes even more gratifying when you realize that you have a pioneering role as a company.
Which data science skills are especially in demand in your job? My job calls for a holistic approach to many different issues. I’m often confronted with problems that first and foremost require a solid grasp of management and strategy. This takes us back to the topic of combining different use cases in order to create a basis for tackling new projects and thus harnessing synergies from the technologies we use. Essential basic skills definitely include being able to ask the right questions and making unpleasant decisions. While data science skills are becoming more and more relevant in everyday life at work, they must serve the needs of specific projects in most cases. In addition, you have to be able not only to plan, communicate and innovate but also to develop technologies, operations and strategies. For changes within the company to actually work, it’s essential to get the right people to become involved in the process: The winning solution may not always be the one that’s best, but it’s the one that the majority accepts.
Do you think of yourself more as a techie or as an analyst? Or as a creative genius, management superhero or generalist wizard? I was waiting for that … I have always had problems with categorizations. I am happy to leave this one for others to hash out.
What do you remember the most when you look back at your studies (MSc in Applied Information and Data Science)? When I applied for the Master of Science in Applied Information and Data Science, Prof. Andreas Brandenberg, the Head of Program, made a strong impression when he mentioned the importance of “identifying the potential in data and learning to use it professionally.” That made a lot of sense to me. Those who enroll in the program and attend modules – such as Machine Learning and Predictive Modelling, Discrete Response, Time Series and Panel Data, Python, Data Driven Business Models, Management of Digital Enterprise, Data Science Projects, Modern Data Engineering, Recommender Systems, Analysis and Modelling of Social Interactions – will definitely develop a deep understanding of the above objective. The fact that the modules and the arrangements with lecturers and partners such as M.I.T. in Boston, the HSG, IBM, SAS, etc. continue to grow doesn’t make it any easier to earn the 120 ECTS credits. But that makes it all the more exciting.
What are the biggest challenges in your job at the moment? I find designing products or services for existing problems to be challenging at times. People often don’t know what they want until you show them the options. Every company has low-hanging fruits. My focus is clearly more on digital activities in the form of technology-driven projects affecting an entire group of companies and less on opportunities to fundamentally reinvent the business by launching strategic digital initiatives. That type of thing tends to be part of innovation management. But clearly, the most difficult thing is knowing when to say “no.” Only when you can say “no” can you focus on what really matters.
What advice would you have for others starting in the same job? Try to implement changes via the proponents and gatekeepers. Make sure that those you work with are at the center of what you do and be sure to form interdisciplinary teams. Encourage collaboration and bring about change. Ultimately, it’s much more of a cultural issue, because digitization will cause you to question and replace tried and tested methods and processes. It’s also essential to have good soft skills. Therefore, I urge everyone to look at their company’s values and develop the strategy based on these. I think it’s evolutionary rather than revolutionary behavior that leads to long-term success and prevents the organization from running into problems. But don’t forget that the traditional business model is still central to any company’s success and that digital transformation is only a means to an end. It’s a process of sticking together and developing continuously for the successful future of the company.
So don’t expect to be able to turn the whole company around overnight: After all, you can’t change the tires of a truck while moving at 80 kph. Companies that have tried this approach have failed – just like those that have missed the chance to change their tires altogether.
And finally: What new hashtag are you aiming for in 2021? If I could choose two hashtags, they would be: #connect #hybrid
Contact us if you have any questions about the degree programme or for individual advice: Tel.: +41 41 228 42 53 / E-mail: master.ids@hslu.ch
Data Science in Social Media
Sign my Bill: Social Network Analysis of the Members of the Swiss National Council
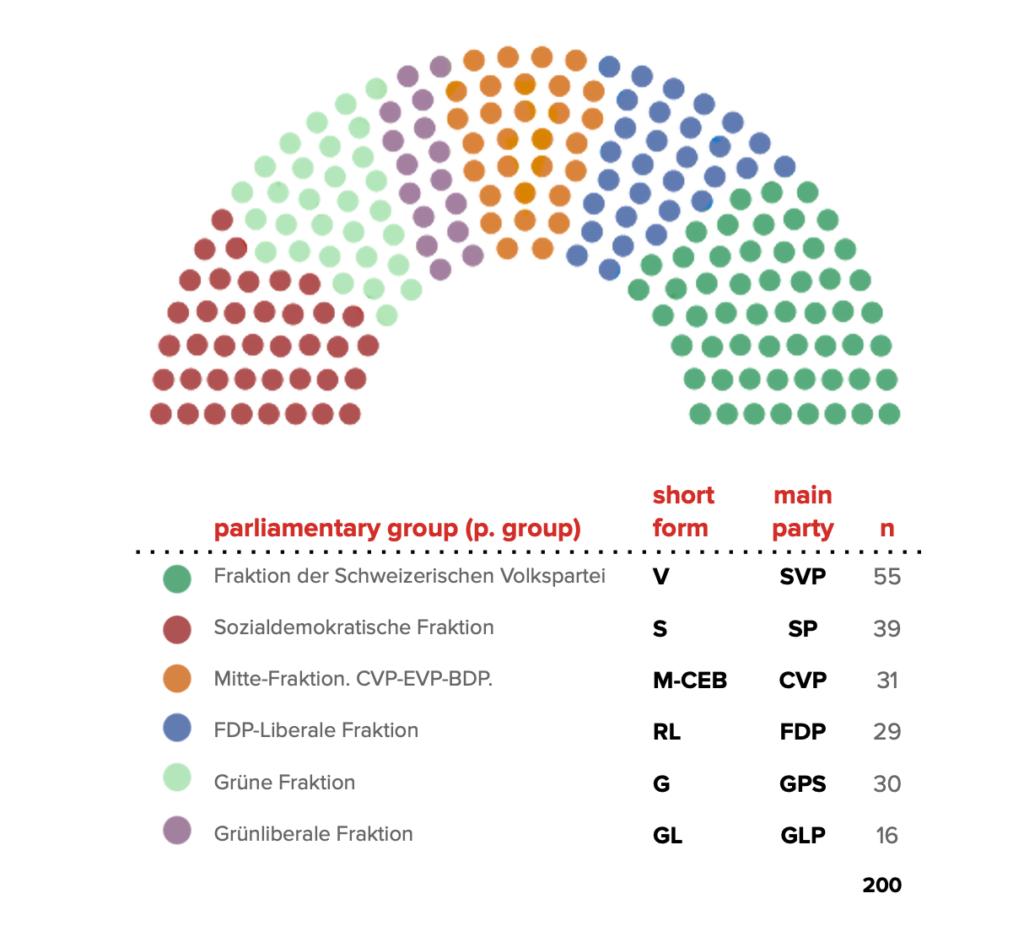
Voting day in parliament receives a lot of attention from the media and voters. But what happens inside the Swiss National Council before and after voting? Legislators need to prepare and submit their requests. To give them more political weight, they can also have their requests co-signed by other legislators. In our social network analysis we quantitatively explore who co-signed whose request in the year 2020 on individual and parliamentary group level.
Analysis of social interaction data
Up to now, the measure of co-signing a request received only little to none attention by the broad public. However, it gives interesting insights into the dynamics within the Swiss National Council:
How diverse is the collaboration between members of the National Council?
Do they only support requests that come from inside of their own parliamentary group (p. group)?
Who are the legislators that manage to build bridges between p. groups?
How does the collaboration between p. groups change based on the discussed topic?
Fig. 1: Distribution of the p. groups in the National Council and relationship between p. group an political party (Own representation, 2020).
To answer these questions, we collected all authors and all co-signatories for the interpellations, motions, postulates and parliamentary initiatives submitted in 2020 (n = 1026) from the website of the swiss parliament ((link: https://www.parlament.ch/en/ratsbetrieb/suche-curia-vista)) with the aid of a custom web-scraper.
Basics of Social Network Analysis
Part of social network analysis (SNA) is to study the structure of social interactions by representing them in a graph. A graph consists of actors (nodes) and how they interact with each other (edges between the nodes). In our SNA, actors are members of the National Council. They interact by co-signing the request of another member.
We used the Force Atlas 2 layout, a classic force-based, iterative algorithm that step by step draws linked nodes closer while pushing unrelated nodes farther apart. The size of the nodes represents the number of different members a member has interacted with.
To describe the network of the National Council, we looked at some key measures of SNA:
density: How many of the possible ties to other members are present in the network?
reciprocity: How many of these ties are mutual?
centrality: How much is each actor “in the center” of a network?
assortativity (of an attribute): Are two actors more likely to interact based on a certain attribute (like the p. group they belong to)?
avg. path length: How many hops apart are two actors in a network?
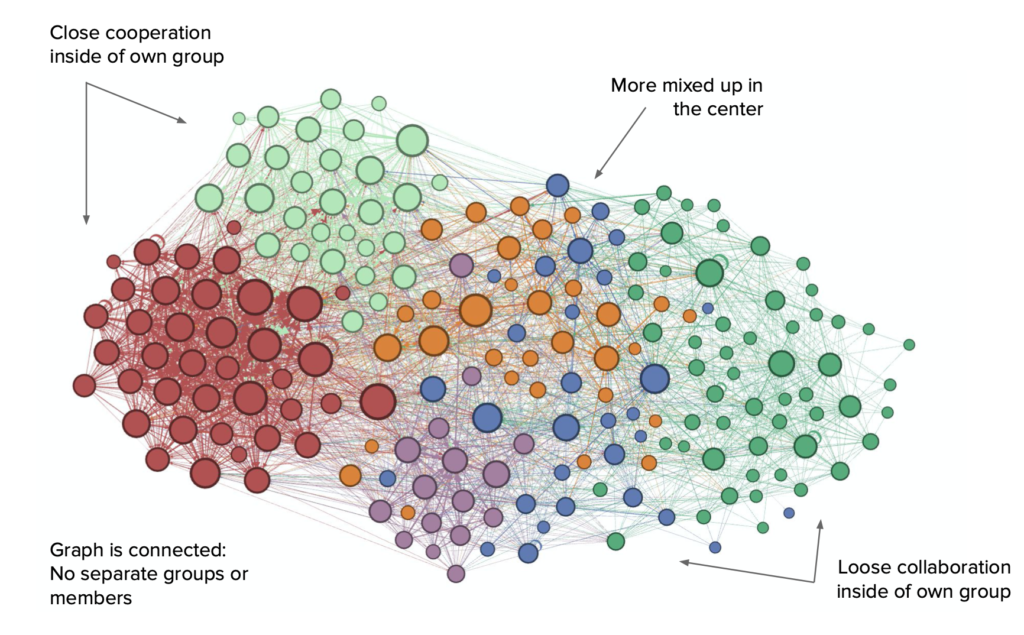
Fig. 2: Visualization of the interactions between National Council. Colors represent p. groups (Own representation, 2020).
Significant Differences in Co-Signing Behavior between Left and Right
In fig. 2 we can see that the interactions between members of the National Council are highly correlated with their p. group. It can also be observed, that there are no separated members. Every member at least co-signed one other member’s request or got someone to co-sign their own request. Also no p. group as a whole is separated or located far away from the others. This suggest that there is no member and no p. group that has no or only weak ties to other p. groups when it comes to co-signing requests. The middle p. groups are indeed in the center of this graph, as we would expect it.
What is particularly striking is that the level of support within the p. groups varies a lot. In the graph, members of the Sozialdemokratische Fraktion and the Grüne Fraktion are very close to their p. group members, which shows that they cosign a very large number of requests within their p. groups. In the Fraktion der Schweizerischen Volkspartei there are seemingly more lone warriors, who are only weakly connected to the network .
Some key measures of SNA:
density: 0.10
Of all the possible ties that could be made, only a fraction (10%) are present in the network. In the National Council it is obvious that not all support each other.
On average a member has interacted with a total of 20 other members (average degree).
reciprocity: 0.43
Slightly less than halve of the ties are mutual (43%).
This seems to make co-signing others requests a valid strategy to get more co-signatures for the own requests.
assortativity of the p. group: 0.44
Which p. group a legislator belongs to plays a role to a certain extent (44%) when it comes to whose proposal they co-sign, but it’s not absolutely crucial.
avg. path distance: 2 hops
On average two members of the council are two hops away from each other. The longest measured path distance between two members in the National Council is 5 hops.
Cross-Party Collaborating Individuals
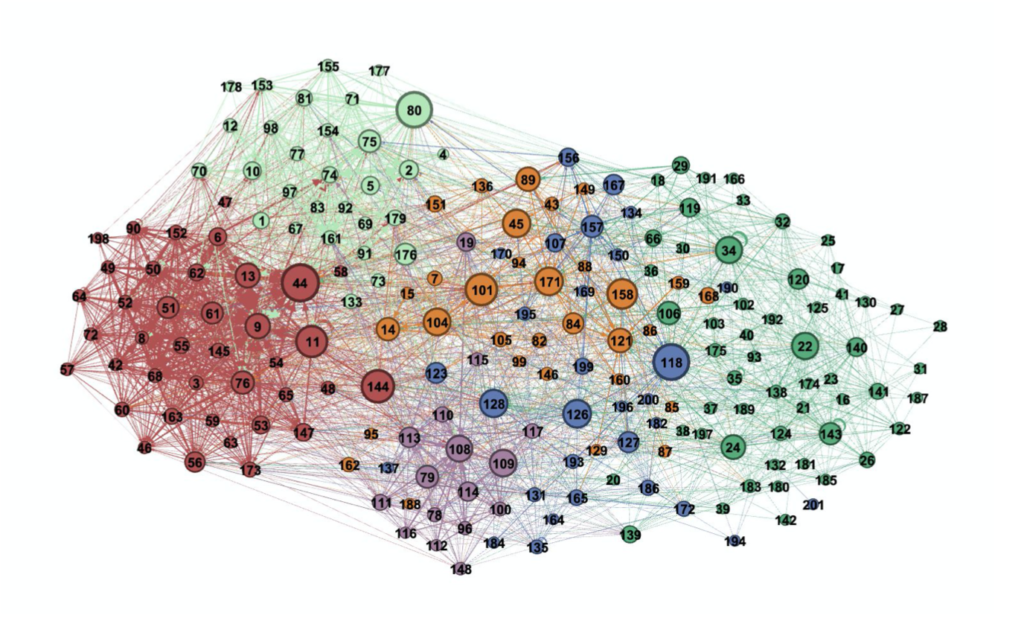
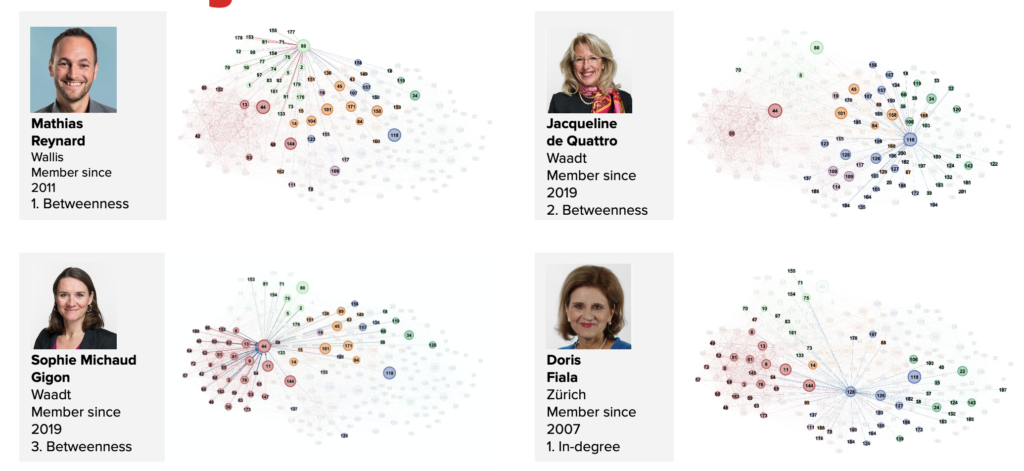
To find the essential members for cooperation across p. groups we looked at the betweenness centrality, which measures how often someone is part of the shortest path between two others.
We drew a new graph, in which the node size now depends on a member’s betweenness centrality score.
Fig.3: Visualization of the importance of members for the cooperation across the National Council. Node size represents the betweenness centrality (Own representation, 2020).
Fig. 3 shows that middle p. groups overall have a higher amount of betweenness centrality. Indeed, we would expect them to be the bridge between Left and Right. Interestingly some of the members with high betweenness centrality scores aren’t members of middle p. groups.
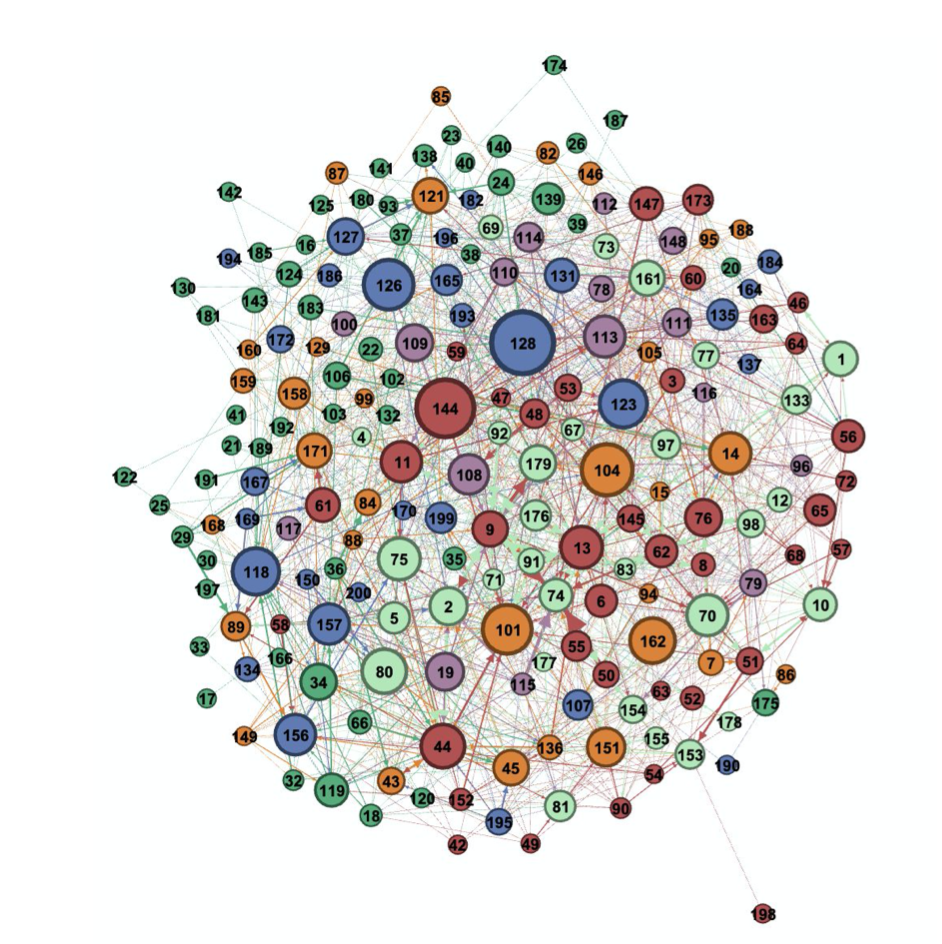
To go a little further we mask the interaction between members of the same p. group and looked exclusively at the interactions that happened between two members of different p. groups. We generated a new graph (cf. fig. 4), in which the node size represents how many co-signatures a member received. The member with the biggest node received the highest number of co-signatures for their requests from members of another p. group.
Fig. 4: Visualization of the importance of members for the cooperation across p. groups. Node size represents the betweenness centrality. Interactions between members of the same p. group have been masked (Own representation, 2020).
Fig. 5: The three legislators with highest betweenness score and the legislator that got the most co-signatures from outside her own p. group (Own representation, 2020).
Topic at Hand is Key for Collaboration
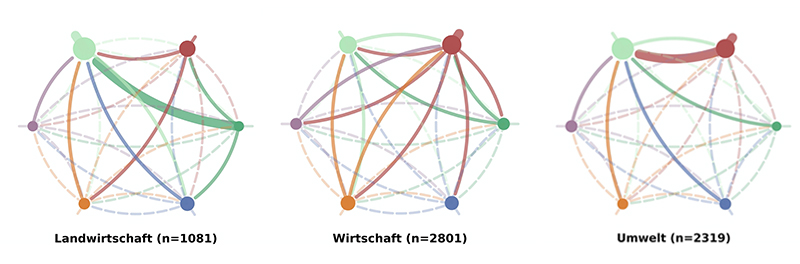
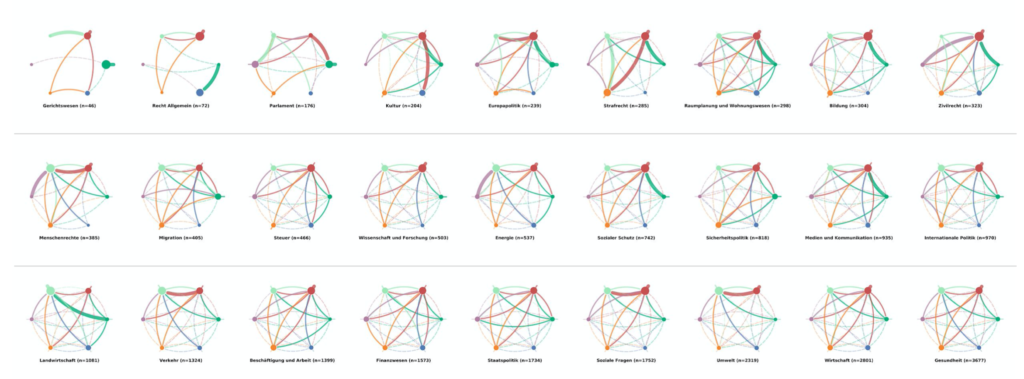
In the last step, we explore the influence of a requests topic on the level of collaboration between p. groups. Therefore, we first aggregated the data by the six p. groups for each of the 27 given topics. The different topics can be seen in fig. 7.
We used the same circular graph template for every visualization, in order to enable the viewer to make a quick and intuitive comparison between each topic. The nodes stand for the p. groups; the size of the nodes represents the amount of received co-signatures.
The edges represent the outflow of co-signatures from one p. group to another but. The outward spikes attached to the nodes represent the flow of co-signatures that stays inside the p. group. The thickness of the edge represents the power of each flow, measured as the share of co-signatures from the total share of co-signatures. A thick edge means >10% of the total share, a regular line <10%; The semi-transparent, dashed line means <2.7%. The threshold value of 0.027 was chosen, as it is the average share given a grand total of 36(=6*6) edges.
The colors of the nodes and edges match the legend in fig. 1.
Fig. 6: Three network graphs on p. group level for the topics agriculture, economics and environment (f.l.t.r.) (Own representation, 2020).
The left graph in fig. 6 shows the flow of co-signatures in the National Council regarding the topic agriculture. We can see that the flow is very concentrated towards the Grüne Fratkion. Most edges are dashed and indicate and week flow of co-signatures. The node of the Grüne Fraktion is the largest, as they receive most of the co-signatures. They also get supported disproportionately much by all the other p. groups. More than 10% of all co-signatures stem from themselves, also more than 10% of all co-signatures flow from the Fraktion der Schweizerischen Volkspartei.
As can be seen in the overview fig. 7 the amount of support each p. group receives from and provides to other p. groups is heavily dependent of the topic at hand. While for some topics the flows are rather homogeneous (e.g. economics, cf. fig. 6), other topics show a picture in favor of a single p. group (e.g. environment, cf. fig. 6).
Furthermore, it is made visible which p. group is active on which topic and collects signatures (or not). For some topics, the separation between left and right is also less apparent (e.g. economics, cf. fig. 6).
Fig. 7: Overview of the network graphs for all the 27 topics (Own representation, 2020).
To take a closer look at the graphs and key-figures like density or reciprocity for each topic, you can access here our interactive pdf.
Authors: Marlen Stalder, Stefan Hüttenmoser
Contact us if you have any questions about the degree programme or for individual advice: Tel.: +41 41 228 42 53 / E-mail: master.ids@hslu.ch
Start your career with the MSc in Applied Information and Data Science now! Register and join us for a free online Info-Event: