Happy or unhappy cow? Data Science takes us closer to animal welfare
Can we use artificial intelligence to help improve communication between humans and cows? Cengiz Cetinkaya thinks so and thus developed a machine learning model for real-time emotion prediction in his Data Science MSc programme at Lucerne University of Applied Sciences and Arts.
Bridging hearts with Data Science: the happy animal revolution
Cengiz’s model aims to gauge bovine bliss levels by identifying anxiety and stress in real-time – using machine learning in images and videos to recognize whether a cow is happy or unhappy.
Artificial Intelligence helps him to rethink animal welfare. Will soon only happy cows graze on our pastures? Cengiz’s Master’s thesis takes us to a trough full of ideas for animal welfare.
A project is underway about launching a “Happy Cow” label that cattle breeders can use to groom the public’s perception of their operations.
And anyone wanting to learn more about their four-legged best friend’s mental state can use the “waggydog” app from the start-up FaunaAI. The first version of the app is for dogs, but prototypes for cows, horses and cats are already in the pipeline.
Data Science: The Impact of COVID-19 on Business Development Using Machine Learning & Natural Language Processing Based on News
Our former HSLU and Applied Data Science student Tracey Etheridge recently attended the IEEE International Conference on Knowledge Graph (ICKG-2022) to present her Master’s thesis entitled “Distilling Business Value from COVID-19 Public Media Dataset with Machine Learning and Natural Language Processing”.
In this Data Science project, Tracey Etheridge used her Machine Learning and Natural Language Processing skills to innovatively analyse a very large news dataset to understand the impact of COVID-19 on business development. Most importantly, she sought to draw some useful lessons that we can apply to future crises. For the project, Tracey worked with Dr. Janna Lipenkova, CEO of Anacode GmbH in Berlin and Dr. Guang Lu, Lecturer in Data Science in Marketing at HSLU.
The year 2020 was obviously a very turbulent time for businesses as it was the first year of the COVID-19 pandemic. Surprisingly, some companies did very well at the beginning of the crisis, while others were hit hard by the pandemic. Why is this? What lessons can we learn from the past to better manage possible future crises? For her Master’s thesis, Tracey wanted to find out if there was a link between the business decisions companies made and their financial performance. To do this, she looked at news articles that mentioned COVID-19, the companies mentioned in those articles and their financial performance.
The core dataset Tracey used consisted of news articles sourced from top business blogs and news sites such as Yahoo Finance, CNN, Reuters and the New York Times. She had a collection of more than 370,000 articles published in 2020. These articles covered a wide range of topics including general business, finance, technology and science (non-medical). It also collected monthly stock prices for companies in some of the major indices in the US, UK, Canada and Australia.
Figure 1 Analysis pipeline for the COVID-19 public media dataset (from Tracey’s conference paper)
Tracey proposed a novel data analysis pipeline based on Machine Learning and Natural Language Processing (NLP) to extract business value from the news dataset. After cleaning the dataset and performing some pre-processing steps, she applied three different NLP methods to extract information from the articles (as shown in Figure 1).
First, she extracted the names of the companies mentioned in the article using named entity recognition. Second, she performed sentiment analysis on the headlines to determine whether the article was positive or negative. Finally, she applied topic modelling to understand what the main topic of the article was. Once she had completed these steps, she was able to merge them to assess whether she could find connections and information that could be useful to businesses.
To identify the companies mentioned in the articles, Tracey used spaCy to complete the named entity extraction by examining objects identified as ‘organisations’. News articles often do not give the full trade name of companies, and the initial extraction also included a number of companies that were not relevant to the analysis.
Tracey therefore developed a matching algorithm to compare the extracted values with a list of companies from the world’s major stock indices. To test the results of the matching, she manually tagged the companies mentioned in 1’000 articles. The tests showed an F1 value of 65%, which is somewhat low. This could be the cause of some potential problems in extracting relationships between the articles and financial performance.
Three models: DistilBERT, FinBERT and RoBERTa
For the sentiment analysis component, Tracey tested three models, namely DistilBERT, FinBERT and RoBERTa. She also tested a majority rule approach using the results from the three models. Tracey then manually tagged 1,000 items to test the accuracy of the sentiment analysis. RoBERTa was the best performing model, so Tracey used it in the final analysis.
Tracey then compared several different topic modelling techniques. One method Tracey used in the analysis was Top2Vec, which is based on Word2Vec and Doc2Vec. The 50 words with the closest cosine similarity values in space represented an entire topic. Tracey also assigned each document within the dataset to a topic. Using this method, Tracey created 1,700 topics.
In order to understand these topics, Tracey had to manually analyse them and give them a meaningful label. However, they were mostly very general and contained a large number of documents, making it difficult to use them to distinguish between companies. So Tracey used an alternative method of defining themes by selecting words that were representative of them. For example, for the topic of ‘cybersecurity’, she selected the words ‘cyber-attack’, ‘malicious’ and ‘vulnerability’.
Using the embeddings trained with the Word2Vec component of the Top2Vec model, Tracey took the average embeddings of these words as representative of the topic. She compared the topic embeddings with the average embedding of the words contained in the document and took the articles that were closest to the topic as related.
Figure 2 Monthly sentiment vs. market movement by country (from Tracey’s conference paper)
The results of the analysis focused on three areas by examining financial performance at country and industry level as well as for individual companies. Figure 2 shows an analysis of the average sentiment of companies from different countries together with the financial performance of the main stock index in that country. There is a slight pattern here – in the early months when positivity was lower, index returns for individual countries are lower than later in the year when positivity is higher and returns are also higher.
Either positive or negative effects
At the industry level, COVID-19 clearly affected different industries in different ways. While many industries were negatively affected, others were positively affected. For example the pharmaceutical industry through the successful development of COVID-19 vaccines or technology companies through increased reliance on technology.
Figure 3 shows the sentiment and market movement for a selection of industries. Real estate and industrials have a relatively high correlation between the sentiment and market movement, while the correlations between the two are rather low for healthcare and energy. This suggests that sentiment can be an indicator of how an industry is performing depending on the sector.
However, Tracey would need to analyse longer-term data to gain a better understanding of the correlations shown here.
Figure 3 Monthly sentiment vs. market movement by industry (from Tracey’s conference paper)
Tracey moved to the corporate level. To do this, she started to look at the topics in more detail. She wanted to find out what the key issues were for particular companies and what the market sentiment was on these issues. She could then combine this with company’s financial performance. As the real estate industry has a reasonable degree of correlation between sentiment and market performance, she looked more closely at the topics associated with the best and worst performing companies in the industry.
In doing so, she looked at the topics that emerged from the Top2Vec model. As mentioned earlier, some of these topics are very general and do not allow for much differentiation. However, one can see some negative topics associated with the worst performing companies, such as ‘bankruptcy’ and ‘litigation’.
Thoughts and outlook
If we continue to look at the themes, but now consolidate the companies at the industry level, we can also see some interesting results. For this dataset and the year of analysis, there are many topics related to COVID-19, as this topic was so present in the media and was a focus of this dataset. However, the information could be more focused on the needs of a particular company by focusing on one industry.
For example, in the consumer discretionary industry, technology topics are strong among companies with a high positivity rate, while topics related to clothing retailers and physical stores are common among companies with a low positivity rate. Information such as this could indicate to companies that they should focus on their technology solutions in market updates, hopefully influencing media perceptions in a positive way.
Conclusion
Overall, there were many aspects that Tracey explored in this analysis. The interesting findings can be divided into two main areas. Firstly, when comparing article sentiment to monthly industry financial performance, the results show that sentiment can be an indicator of an industry’s performance depending on the industry. Second, companies could use the results of topic modelling and sentiment analysis to gain information about the media’s attitude towards company issues. Or to identify important topics related to competitors.
This information could help inform overall corporate strategy and communications. A further consideration for the future is whether improved topic generation could enable deeper, more meaningful connections between the elements studied. Since the completion of this work, the dataset has been extended to 2022. Therefore, it would be particularly interesting to extend the time span and see if the correlations between sentiment and financial performance persist over time.
Interested in more information?
Click hereto read the full paper Tracey presented at the Conference.
Read the professional portrait with Data Scientist Tracey Etheridge here.
We would like to thank Dr. Guang Lu for sharing this very interesting project portrait with us!
Reference T. Etheridge, G. Lu, and J. Lipenkova, 2022. Distilling Business Value from COVID-19 Public Media Dataset with Machine Learning and Natural Language Processing. In: Proceedings of IEEE International Conference on Knowledge Graph (ICKG-2022), 30 November – 1 December 2022, Orlando, FL, USA.
Start your career with the MSc in Applied Information and Data Science now! Register and join us for a free online Info-Event:
Professional Data Scientist portrait with Tracey Etheridge
Our graduate Tracey Etheridge has decided to dedicate her professional career entirely to Data Science. Why? Because she loves getting the most out of data and helping companies understand and use data the right way. In our career profile, Tracey also tells us why creativity and flair are so important in her job as a Data Scientist and what she enjoyed most about studying Applied Information and Data Science at HSLU. Happy reading!
First of all, tell us something about yourself: Which hashtags describe you the best?
#nohashtags but I would describe myself as someone who loves to learn new things and has a fairly positive outlook.
Tell us more about them:
Discovering something new or learning new skills keeps life interesting. I’ve continually completed formal education throughout my career, originally professional accounting qualifications, then further master studies in applied finance and now data science. There are so many things to learn that help us be not just better at our jobs but help to evolve as people when we remain open to new ideas, approaches or other people’s experiences.
Now let’s talk about your professional life: What do you do at TX Group?
I’ve worked in data analytics for 20 Minuten and now as data scientist for Goldbach Group. I am responsible for helping the business make the most out of data. Some of that work involves working on our prediction algorithms for targeted advertising, factors such as gender and age. Another interesting project is predicting audience sizes for replay tv. I also help the business understand the data we have, what the data means for the business, and what potential uses can be made from it.
What did you do previously and why did you join …?
I worked in accounting and finance roles for 10+ years. I really loved my work, particularly in finance business partnering roles, where you work with different parts of a business to help them understand their business and analyse new opportunities. But I also love technology and as more and more data was becoming available, it was becoming difficult to analyse it with traditional finance methods and tools (i.e., excel). So I looked into what more I could do and learnt more about data science techniques. I originally thought I would use the skills to enhance my finance career and broaden the analysis I could do, but I just loved everything I was learning so much that I decided to focus 100% on a data science career.
Tell us about the most exciting thing in your job:
Learning new things and problem solving. Often, like many things in life, you don’t immediately know how to solve a problem you are facing. That doesn’t generally feel very good and can be scary and stressful. But then the fun bit starts when you start to think through the issues and what you might be able to do to solve them. And when you don’t have the answers, you go out searching and learn new things to help, and you interact with new people with new ideas that help open up your thinking.
Which data science skills are especially in demand in your job?
From a technical perspective: SQL, python, workflow management, AI/ML techniques. But then you also need to be able to understand the data and bring it together in a meaningful way that enables insights that can help move the business forward. You also need to have ideas of what is possible and what might help the business.
Do you think of yourself more as a techie or as an analyst? Or as a creative genius, management superhero or generalist wiz?
I would say I am a generalist with very strong technical and analysis skills.
What do you remember the most when you look back at your time in the MSc in Applied Information and Data Science programme?
Zoom. I started in the pandemic and finished in the pandemic, so a lot of online activities. In regards to the coursework, the project work was most interesting to me and was where I had a lot of fun. In particular, I really enjoyed scraping the web to get information on coronavirus cases, and a project where we predicted restaurant turnover for actual restaurants in Zürich. But my favourite project was computer vision based, where my group generated faces based on book descriptions of characters.
What are the biggest challenges in your job at the moment?
Having enough time to do everything I want to! There are so many ways data science can be used within organisations and one of the biggest challenges is how to prioritise what gets the limited time resources we all have.
What advice would you have for others starting in the same job?
Ask a lot of questions. Understanding data, business, and possibilities is incredibly important and one of the best ways to gain this knowledge is from other people that are already experts in their areas. Also finishing a degree doesn’t mean the learning has stopped, working on projects at home is a great way to broaden the skills you have. Guided online courses are great for introducing new skills and ideas but when you pick something where you really need to think through the steps and solutions yourself, I find I learn so much more.
And finally: What new hashtag are you aiming for in 2023?
#nohashtags but I would like to continue to learn and develop and really put into practice all the things I learnt in my Masters.
We would like to thank Tracey Etheridge for her dedication and time to share with us these precious insights.
Start your career with the MSc in Applied Information and Data Science now! Register and join us for a free online Info-Event:
Applied Data Science – Social AI: Save The Amazonas Rainforest
with Artificial Intelligence and Alexandra Strohmeier. Data Science spotlights sustainability. Data Science is on everyone's mind – be it in business, medicine or the arts – and can play a key role in solving a range of riddles. That's why Alexandra Strohmeier, a graduate from our programme, dedicated her Master's thesis to the topic of how Data Science can help us fight climate change. Or more precisely, how artificial intelligence (AI) can stop the destruction of the Amazon rainforest before it's too late. Read Alexandra's article to learn what she found, about ways of beating the clock, and other insights about what the future holds in store. Happy reading!
Why the rainforest is so important for our future?
The ominous consequences of a destroyed and threatened Amazon rainforest are striking not only for the people and animals there but trigger a ripple that affects all of us worldwide. Effect: Chopping down the rainforest accelerates climate change. Cause: Nowhere else are more trees being chopped down than in the Amazon rainforest (Laurence, et al., 2002). The Amazon basin has about 60 percent of the world’s remaining rainforest – and biodiversity will suffer if human activity causes it to shrink further. The logical consequence is that the regional and global climates are thrown off balance.
The numbers speak clearly for themselves: The latest studies indicate that the rainforest currently emits more CO2 than it binds. In fact, tropical rainforests are known to absorb CO2 and play a key role in the fight against climate change. For example: The Brazilian part of the Amazon region released about 18 percent more CO2 between 2010 and 2019 than it stored. In other words, the Amazon basin released around 16.6 billion tons of CO2 into the environment but absorbed only around 13.9 tons (Thome, 2021, p.1).
Some impressions from the deforestation of the Amazon rainforest:
AI as both a crystal ball and a protective shield AI can add value by helping us identify risk areas in the Amazon rainforest at an early stage and thus find ways to actively counteract deforestation. This is exactly what I tried to study in detail in my Master’s thesis. I developed AI models that can play a mediator role, not only for identifying risk areas but also for visualizing potentially serious detrimental effects and predicting them, for example for the benefit of political parties looking to take preventive measures and protect the areas.
For my research, I asked myself: “How effectively can AI predict deforestation risk areas and to what extent can structured and non-structured data contribute to the overall effect?” To answer this question, I used various deep-learning algorithms. Deep learning in turn relies on artificial neural networks that enable a computer to learn from historical data. The prerequisite for this is that the computer is “fed” with data. In my case, I used satellite imagery from Sentinel2, an Earth observation satellite of the European Union’s Copernicus programme, as well as structured data on population, socio-economic factors, crime and land use.
Predicting deforestation thanks to mixed-data neural networks Artificial neural networks need a lot of data to ensure reliable classification, and I thus chose the largest possible area for my research, i.e. the entire Brazilian Amazon basin.
I obtained the deforestation data with the help of PRODES (Programa Despoluição de Bacias Hidrográficas), a project of the Brazilian government. I then created a model by using mixed-data neural networks consisting of a coherent combination of several neural networks. Both satellite imagery and structured data can be used simultaneously as input dimensions, so combining different data sources and data types allows for better classification.
I found some examples in my research of how deep-learning models can be used to identify the deforestation of the Amazon rainforest. The substantial difference is that my project identifies the risk areas and doesn’t just focus on deforestation per se. In other words, I focused on areas that are still intact but that could potentially be deforested.
Procedure: All good things (models in this case) come in threes
The artificial neural networks I created in my project are meant to identify those areas that are at risk of deforestation. At first, whether legal or illegal logging was taking place in the affected areas was not so important. How did I go about this? I first used two models, namely the convolutional neural network (CNN) and the multilayer perceptron neural network (MLP) to identify the risk areas.
First model: The MLP helped me to process the structured data and use it to predict which areas were at risk of deforestation.
Second model: The CNN, on the other hand, let me predict deforestation risk based on visual indicators such as satellite imagery. The unique thing here is that these images have a normalized difference vegetation index (NDVI) that measures vegetation. In other words, the CNN shows how many trees grow in a particular area.
Third model: Finally, I combined the first two models into a single third model. With this multi-input model, which can process different data types, I wanted to achieve higher accuracy and better classification.
I used the logging data from PRODES for the labelling, which meant defining the risk areas by dividing the region in question into a grid based on the structured and unstructured data I was using. The grid is made up of cuboids corresponding to the size of the individual satellite images. A risk area is subsequently a cuboid in which the model predicts the risk of deforestation.
No project without hurdles and challenges Preparing the data for the structured model was harder than I had anticipated. The challenge was to study the above-mentioned data sets in detail, all of which also contain a geo-component, and to convert them into a relational format.
For this, I converted the data into geopandas data frames that enabled me to aggregate and merge the datasets based on the geography (the cuboids). A tricky step, because some of the relevant data, such as on conflicts, did not have a point in every quadrant in the grid, and I thus had to use another method for those cases. For conflicts, roads, airports and so on, I took the distances into account and calculated how far apart the data points are for each quadrant.
I then assigned the labels “risk area” and “no-risk area” based on the deforestation data. This meant calculating how many square kilometers were deforested in the different quadrants by assigning the label “1” to quadrants with deforestation (risk area) and the label “0” to those without deforestation.
Results: AI looks into the future
After preparing the data, I divided it into a training data set and a test data set. The training dataset had 33,449 quadrants and the test dataset 11,148 had quadrants. Modelling the structured data using an MLP had a 75.2% accuracy for the training dataset and a 74.9% accuracy for the test dataset. On the other hand, the visual model with satellite images had an 85% accuracy for the training data set and a 79% accuracy for the test data set. This told me that the unstructured model produced better results.
In the course of the experiment, I also frequently noticed some overfitting problems in the unstructured models, a phenomenon whereby a machine learning model excessively adjusts, or “overfits,” to the training data it knows and thus responds poorly to new, unknown data. One way to avoid the overfitting effect is to use large training data sets, for example.
A Resnet50 architecture enabled me to achieve the best results because it’s a 50-layer-deep model that can be used to train nested neural networks. In other words, I gave the Resnet50 architecture the task to recognize satellite images. I think it did a very good job and produced results quickly.
Mixed-data neural network: Special architecture for more accurate results After validating and testing the various models, I combined them into a mixed-data version. Working with mixed-data neural networks requires several specific steps in preparing the data. For example, I had to use the special data generator functions in Keras to enter both data types. Keras is an open-source library for deep learning in Python and helps to create and train neural networks and implements special functions such as data generators, which in turn can feed data into the model.
I used the following network architecture for the mixed-data neural network with the best performance:
It contains the ResNet50 model from the CNN and is combined with the MLP. Furthermore, it introduces regularizations. The results of the model show a good line progression without any overfit. Both lines become more accurate in time, with validation loss decreasing steadily. The test is 79.37% accurate; training is 79.38% accurate.
I worked with a Confusion Matrix to help me understand the performance of a model in terms of accuracy, sensitivity, and specificity. I found it to be a useful tool for assessing classification models because it gave me the number of correctly and incorrectly classified examples to decide whether the model needs improvement or is suitable for the given task.
The confusion matrix above shows that 6,562 values are “true negatives” and 2,287 are “true positives.” It produced only 454 “false negatives” and 1,845 “false positives.” For me, this combined mixed-data model clearly shows that it delivers better results than the isolated MLP and CNN models.
The following visualization compares the predicted and true labels and shows that the mixed-data neural network recognizes most risk areas. Only in the northwest region is the density of identified risk areas lower than for the true labels, which means there is still room for improvement.
Conclusion: AI can help save the Amazon rainforest
Visual models like CNN perform better than structured models such as the MLP. This is because already tried-and-tested network architectures such as ResNet50 were used. What I liked the most was that the combination of the different models achieved the most considerable values, thus eliminating the problem of overfitting.
In summary: The accuracy in the mixed data model was 89% for the training data set and 79% for the test data set. I can thus confirm my hypothesis that combining structured and unstructured data helps to make more accurate predictions. With AI’s help, we can anticipate the risk areas in the Amazon basin and consequently protect them from deforestation and destruction.
Outlook: Still some room for improvement
We might be led to conclude that all’s well and good. Having finished my Master’s thesis, however, I’d like to zoom out and summarize my findings as follows: Modelling naturally has its limits. And the data labelling method is not error-free by any means, on the contrary. For example, when it comes to identifying patterns in satellite imagery that could lead to deforestation based on unstructured data, CNN may produce better results.
Furthermore, it would be interesting to learn how different labelling methods affect the model quality. In this case, the model made it hard to predict deforestation, which was not yet visible in the cuboid with a deforestation label. However, I would be very interested to see how the models would change if the images were labelled so as to show deforestation in the individual images. In addition, distinguishing between legal and illegal deforestation would mean a big step forward because we could then classify the latter. And, last but not least, it is certainly important to include further structured data to identify factors other than those already known to be endangering the Amazon rainforest.
I have already thought a lot about how to proceed with the project. As a first step, I would very much like to publish the project and also make the source code accessible as an open source project. It remains exciting, more about that at a later date.
Applied Information and Data Science – Study Week in Bangalore, India
How exciting! A group of our Applied Information and Data Science students have landed in Bangalore, India, in order to go on a one-week-study tour to “Electronic City”. Thanks to it, Bangalore is worldwide known as a vibrant innovation hub. They were accompanied by Prof. Dr. Andreas Brandenberg (Head of Programme), Prof. Dr. Andreas Liebrich (Deputy Head of International Office) and Oliver Staubli (Lecturer). Dive into our Diary to feel the breathtaking Indian culture and get with us in touch with a bunch of data-science-related companies and their high-class representatives, as well as with local people. Enjoy reading.
February 4: Tiger Safari at Bannerghata National Park. Mini-Hackathon with Business Analytics Students from JAGSoM
February 5: “Good-bye Bangalore”. Flight back to Switzerland
PART 1: Bangalore – here we come!
Dear Diary, you’ve certainly heard of the “Electronic City”, haven’t you? India. –> Bangalore – THE vibrant innovation hub worldwide. It is one of India’s largest IT industrial parks, spread over 3.2 km² in Konappana Agrahara and Doddathogur villages. But did you know that it includes about 200 IT company campuses and even universities, for example the JAGSoM University (Jagdish Sheth School of Management) which is our host. It is a smaller business school with quite a strong business analytics department.
So, on my first days in Bangalore, I have met my local partners and can sum up that two things are absolutely fantastic here: A campus surrounded by greenery. Bangalore, as a whole, is considered a green city with decent temperatures all year long. In beginning of February, our students may expect low humidity, a lot of sunshine, no or few rainfalls, and temperatures between 24 and 32 degrees at noon.
But JAGSoM has a lot more to offer. For example, they have a great social service learning system, which means that students go out into the 13 million city and teach young people without access to the (official) school system or provide their knowledge to non-profit organisations. This culture is strongly influenced by Jagdish Sheth, Sanjay Padode and Atish Chattopadhyay, the three leading members of the directorate @JAGSoM. I was lucky to meet all of them and have the privilege to do so several more times during our stay here in Bangalore. They are fascinating personalities with social leadership philosophy, which appeals to me a lot.
Furthermore, there is a wonderful spirit on campus. I have met three young female bachelor students. One of them, Shikra, showed me around the campus. In India, there is a kind of minimum standard for university lecture halls. The school has purposefully equipped some rooms this way so that students can stay “grounded” and exercise their privilege.
The next days will be exciting. On Sunday, we will go on an extended city tour and on Monday we will meet expats from Switzerland. In the evening, there will be a dinner reception on the roof of the Counsulate General of Switzerland with more than 80 invited guests, all of whom will play a crucial role in the study week. I am looking forward to it!
In the upcoming days, you will be updated of how it’s going. 😊
Part 2: Between Holy Temples and Botanical Gardens
Dear Diary, finally our group of Applied Data Science students has safely arrived in Bangalore. In the evening at 7 pm, after passing the immigration section and changing our SIM cards (data is unbeatably cheap in India), we have checked in to the Lemon Tree hotel in “Electronic City” and enjoyed a fine Indian meal. The next day started early with a beautiful sunrise. We’ve had breakfast with some Business Analytics students from @JAGSoM University (Jagdish Sheth School of Management). Afterwards, a yellow bus, built in 1950, took us to the hostel of the Bachelor students – young, curious and bright Indian people who welcomed us very warmly.
Together, we went on a sightseeing tour to the Dodda Basavana Gudi, one of the oldest Hindi temples in Bangalore (photography prohibited) and from there to the Lalbagh Botanical Garden being a home to many beautiful plants. Having just escaped the winter in Switzerland, we perceived the colors and smells even more intensely. At the end of the garden tour, there was time for an extended and very delicious Indian lunch.
Living and working in India: Bühler Group, Swissnex and more What a day! On Monday, we went to Bühler Group, a Swiss family business in the fifth generation specializing in high-precision process technology. This hidden champion is virtually unknown to most people because the company is exclusively in the business-to-business sphere. Yet, we consume products made on Bühler machines every day.
For example, most of the world’s pasta is produced by Bühler equipment, most of the world’s grain is processed on Bühler’s mills. Countless people wear eyeglasses, use smartphones, and read newspapers and magazines – all of which depend on Bühler process technologies and solutions covering our basic needs for food and mobility every day. Having this global relevance, Bühler is in a unique position to doing its part to protect the climate and reduce energy, waste, and water in its customers’ value chains by 50% by 2025. Bühler’s purpose is creating “innovations for a better world.”
So, what started out as a harmless company visit turned into an absolute highlight for us. In a rarely impressive presentation, Prashant Gokhale (President Buhler Group, Region South Asia and Managing Director), Venkatesh Kumar (Head of Human Resources & Administration) and Sunil Ranade (Head Strategy and Business Development) gave us very concrete examples of how Bühler is contributing to a more sustainable agriculture in India.
Agriculture and food production consume nearly 2/3 of the energy produced and an equally high proportion of water. Technological advances in this area therefore carry a lot of weight. And invariably, Data Science and AI play an absolutely central role. Correspondingly, we had a very lively panel discussion as the topic fascinated us highly.
Roof Top Party: Meet and Greet with corporate and academic representatives This highlight was followed by the next: In a typical Indian restaurant, we met Jonas Brunschwig and the crew of Swissnex in India, Consulate General of Switzerland. Jonas is the Consul General and the CEO of Swissnex, the Swiss innovation and research hub in India.
We learned what it means to live and work in India, not only from the perspective of the (mostly) highly privileged expats, but also of the local people here. In the evening, we had the pleasure to attend a “Roof Top Party” at Jonas’ residence and to meet all the corporate and academic representatives from the Indian Institute of Science (IISc)Bosch, Dell Technologies, NASSCOM, and more – all playing a crucial role in our study week. I am just absolutely blown away by the warmth and openness of our Indian friends. We are very lucky to have the chance to meet professionals from various application areas of data science and gain insights into Bangalore’s stunning data science ecosystem!
Between Holy Temples and Botanical Gardens
Part 3: Meeting speaking avatars on futuristic campuses
Dear Diary, did you know that the success story of Bangalore is inextricably linked with Infosys? To my shame, I must confess that I didn’t know this company for a long time. Only created in the early 1990’s, Infosys has grown in less than 40 years from a garage company into a giant with over 300,000 employees and $17 billion in revenue. Infosys’ mission is Business Acceleration, which means they help companies, organizations and institutions transform digitally from within.
By the way, one of the founders of Infosys is Narayana Murthy, the father-in-law of British Prime Minister Rishi Sunak. We didn’t care about big politics, though. We wanted to know how Infosys works. And, of course, we wanted to explore the Infosys campus by which we were simply left breathless.
Better people’s lives thanks to Artificial Intelligence: IIIT makes it possible Just across the street is the International Institute of Information Technology Bangalore (IIIT) located, the first ever institute of this kind in India. Having a chat with the Dean (R&D) and Professor at IIIT, Srinath Srinivasa at the Roof Top Party the night before, I had arranged our spontaneous visit to the IIIT the next day. Srinath had invited six professors and startup founders who gave us a fascinating insight into its projects.
IIIT does exactly what has always interested me most about Data Science: they combine social research with high-end information technology in order to improve people’s lives. Just one example: They have developed a system that translates spoken or written language directly into sign language and vice versa. Deaf-mute people can thus talk to anyone via an avatar – not just people who know sign language. Another project is based on self-explanatory Artificial Intelligence – software that explains why an algorithm comes to a certain result. This is a very important project because many people do not trust Artificial Intelligence, because they don’t understand what it actually does.
In the evening, we were invited by the faculty of our partner university, the Jagdish Sheth School of Management to a welcome dinner in a hotel bar. There was lots of laughter and lively discussions until late at night. At some point, I raised the white flag and went to sleep. My students must have had the longer run. 🙂
Why is India so innovative? My preliminary conclusion: Because researchers in India like to share knowledge, ideas and experiences and are more interested in joint success than in personal glory. And when this is done by researchers from a population of 1.4 billion people who want to improve their lives and who are looking for perspectives – not only for themselves, but also for their families – then great things can happen.
Today, we had the opportunity to visit NASSCOM, an innovation incubator that serves around 10,000 startups. We learned that India’s technology miracle is not only due to the sheer size of the country (or rather continent), but also to a clever funding strategy.
Innovations take place not only on a large, but also on a small scale such as the smart medicine dispenser, the smart washroom or the smart “Healthometer” which measures seven important health values (including blood pressure, blood sugar and blood fat – without needing any blood). How does it work? The answer is sensor technology and Artificial Intelligence. And what’s always very important in India is that the products must be inexpensive.
Contrasting sceneries and aromatic Whisky tour What always fascinates me in Bangalore is the rapid change of scenery. On a poorly paved street corner, a fish seller can be offering his wares on the loading deck of a three-wheeled Vespa, and a few steps later you’ll find yourself in a high-tech center.
In the afternoon, we were invited to visit the Amrut Distillery. This distillery produces, among other things, a wonderful Single Malt Whisky that enjoys world renown. That’s impressive as South India has (had), in contrast to North India, no whiskey tradition in the past. The tour through the distillery was unique. First, we were allowed “to stick our noses” into every fermentation pot – quite different from what one is used to in other (sterile) tours. And secondly, the Amrut Distillery does a lot by hand because they want to guarantee a regular income for as many people as possible.
Fun Fact: We are happy to be accompanied by our Indian friends on our tour almost every day. This time, it was Yothi and Tuhin. We are looking forward to more adventures!
Part 4: Meeting “Boschers”, tigers and new friends in Bangalore
Visiting world-renowned research institutions and a traditional company that is so much more than it seems Dear Diary! Here we go again. The first part of our Study Week in Bangalore is over and we dive into the world of world-renowned research institutions. On Thursday, we visited the Indian Institute for Human Settlements (IIHS), for example.
The institute is well known in connection with the UN’s Sustainable Development Goals. It is mainly concerned with the sustainable development of cities – a particularly important topic considering that soon 2/3 of humanity will live in cities, often unfortunately in very precarious conditions. By the way: the presentation took place in the same conference room where, just over six years ago, Standard 11 (“Sustainable Cities and Communities: Making Cities and Settlements Safe, Resilient and Sustainable”) had been signed.
Not far from the IIHS, you’ll find one of India’s most prestigious research and educational institutions, the Indian Institute of Science (IISc). The founder and director of the Center for Supercomputing and Data Science, Prof. Sashikumaar Ganesan, gave us insights into some projects. Furthermore, PhD students presented their technically challenging projects and methods (e.g., integration of mathematical and algorithmic methods). The humility and competence of the students, some of them very young, was impressive.
Are you a “Boscher”? Visiting the Bosch Smart Campus The last station of our day was dedicated to Bosch. Bosch maintains a state-of-the-art development center in Bangalore with several thousand engineers, software specialists, data scientists, and so one. Most of you probably know the Bosch company as a supplier of hand tools. But this is only a very small part of its product range. Bosch products have a more or less great impact on our everyday’s lives – in most cases unknowingly.
For over a hundred years, Bosch has been active in India and we had the chance to meet some representatives of the second and third generations of “Boschers” – as they affectionately call themselves.
The company is strongly value-driven and embraces its responsibility to people and the environment. For example, they identify themselves strongly with the 3 P’s: “Profit, but not at the expense of the People and the Planet”. Moreover, Bosch maintains a Mobility Think Lab that works on solutions to mobility issues in the rapidly growing Bangalore (+13.6 million inhabitants).
Fun Fact: If you ask someone where Bangalore’s centre is, everyone will smile and reply: “It’s moving”.
Bosch also operates an innovative workplace management system that saves considerable resources such as space, water and electricity without reducing the comfort and well-being of its associates. This concept could actually be implemented anywhere. In my opinion, this is a great example of how using intelligence can contribute to sustainability.
On Friday, our students had the opportunity to choose between three companies to visit: Dell Technologies, LatentView Analytics and JCPenney India. Full of impressions they returned back to the Lemon Tree Hotel where we had checked in earlier this week and spent the evening with some music and dance.
“The tiger is loose” Our last day in India was dedicated to the king of the Indian fauna, the Bengal tiger. In a minibus, we meandered on bumpy roads through the picturesque Southern Indian landscape. Our destination? The Bannerghatta National Park. Here, the wild animals move completely freely in a very extensive area. The big predators like lions and tigers, elephants and bears are separated from each other by an extensive fence system. We felt like we were on a safari. India also has an incredibly diverse flora. I really soaked up the colorfulness of the blossoming trees once again before heading back to cold climates.
In the afternoon, we had a hackathon at Jagdish Sheth School of Management (JAGSoM University) together with some advanced students. A hackathon is a small competition in which students try to solve a prediction problem. We deliberately worked with mixed teams (HSLU/JAGSoM). The most important thing about the whole exercise was the collaboration in an intercultural context – and the students did an excellent job!
Saying goodbye to new friends In the evening, it was time to say goodbye to our hosts from JAGSoM University. We were invited to a big dinner and it was again a very warm and cozy evening with our new Indian friends. It is impressive how open, curious and benevolent our hosts were. On Saturday evening, we went early to bed because we had to leave the hotel at 4 am to reach our flight back home to Switzerland. And for now I can definitely say that I will come back to India with a group of students.
Applied Data Science – Machine Learning on Graphs: Link Prediction in Social Networks
Rita's master's thesis and publication focuses on know-how development for the company Beekeeper together with one of the largest airports in Europe. The research focus is on optimizing communication between employees and management and the operational processes. How accurate is machine learning in extracting and predicting employee relationships? Find out, enjoy reading.
Rita Koranyi – Applied Data Science student HSLU Paper/Publication: GDPR-Compliant Social Network Link Prediction in a Graph DBMS – The Case of Know-How Development at Beekeeper Poster: Applied Machine Learning Days 2022
Introduction
Can you first tell us a bit about your background?
After nine years with a software company, I decided to make some changes and thus signed up for the Master of Science in Applied Information and Data Science in February 2020. After doing many lessons at home, I started on my thesis, together with the company Beekeeper. After all, I really wanted to do a project with graph databases and graph machine learning.
The Project
Now regarding your project: tell us about it
My master’s thesis title is Machine Learning on Graphs: Link Prediction in Social Networks.
In this study, the research of user interaction data in a graph database was compared with graph machine learning algorithms for extracting and predicting network patterns among the users.
The project was realized together with Beekeeper. Beekeeper is an enterprise social network, that empowers companies to close communication gaps and improve collaboration between frontline workers and management. Beekeeper is a tool is not only built for communications, but also for optimizing company operations such as shifts, internal documents and in general internal communication management. They have been among the pioneers in the enterprise social networks as a service field and they have very important key companies in their portfolio. Beekeeper provided me with an anonymized dataset. We wanted to learn more about whether this data, in the form of graphs, could be used for machine learning.
My research focus lied on optimizing their communications and operations and the project focused on one of the largest key customers in the transportation industry in Europe. Specifically, the use case was, to find out how accurate machine learning is, when it comes to extracting and predicting employee relationships. A lot of information gets lost through anonymization, but data privacy is a very important aspect of managing and protecting personal data.
The amount of available information in the digital world contains massive amounts of data, far more than people can consume. Beekeeper AG provides a GDPR (General Data Protection Regulation) – compliant platform for frontline employees. They typically do not have permanent access to digital information. Finding relevant information within this platform to perform their job requires efficient, filtering principles to reduce the time spent on searching, thus saving work hours. However, with GDPR, it is not always possible to observe user identification and content. Therefore, this paper proposes link prediction in a graph structure as an alternative to presenting the information based on GDPR data.
The results showed that, although the accuracy of the models was below expectations, the know-how developed during the process could generate valuable technical and business insights for Beekeeper AG.
What data did you use, what methods did you apply, and what insights have you gained or hope to gain?
Beekeeper provided me with an anonymized dataset because we wanted to learn more about whether this data, in the form of graphs, could be used for machine learning. Specifically, the use case was to find out how accurate machine learning is when it comes to extracting and predicting employee relationships. A lot of information gets lost through anonymization, but data privacy is a very important aspect of managing data.
How can your findings be used to help society?
When we validated the results we could clearly see, among other things, that chat requests tend to stress and distract people at work. I think such insights can add value for a company when designing their workplaces and optimizing their processes. It could be exciting to use the findings for designing the physical spaces as well as the virtual settings in which employees communicate. It’s important to put the emphasis on the “how” rather than on the “what.”😉
Article Publication and Poster
I had lots of fun working on this project. That was also a very important factor for my supervisors (Jose Mancera and Prof. Dr. Michael Kaufmann) and me to submit an article, based on my MA thesis, for the journal of the Multidisciplinary Digital Publishing Institute (MDPI). MDPI is a pioneer in scholarly open access publishing. I had never thought about writing an article to publish before, and I remember being very excited about it and about the “Let’s do it!” in the last sentence of the kick-off call.
I felt so motivated and thus also signed up for a poster presentation for theApplied Machine Learning Days 2022 (AMLD). I was so happy when I got an email telling me, that my topic had been selected! #hooray
How are you looking to develop your project further?
I spoke with Jose Mancera these days about what had happened to my project at Beekeeper. My research was a pioneer topic at the company. I hope that other students might continue as a thesis or a project work at Beekeeper and improve my models or add different perspectives. I believe graph machine learning and graph databases will get more and more attention in the industry, therefore I will keep myself further up to date on this topic. 😊
How did your studies (MSc in Applied Information and Data Science) influence the project?
I think, quite frankly, that none of this would have been possible without the programme. Otherwise, I would not have had the personal contacts and would not have been able to publish the article. The Head of Programme Prof. Dr. Andreas Brandenberg also supported me at the Applied Machine Learning Days conference, which took place after I graduated.
What advice would you give others who are starting a project?
I think enthusiasm for the topic is the most important thing. You can learn anything … 😊
And finally: What new hashtag are you aiming for in 2023?
#itwillallworkout
We would like to thank Rita Korányi and her supervisors for their dedication and time to share with us this wonderful Research Project Portrait.
We want to thank Rita Koranyi for sharing this super interesting project portrait with us!
Start your career with the MSc in Applied Information and Data Science now! Register and join us for a free online Info-Event:
Our former HSLU and Applied Data Science student Silvan Leibacher is the founder of EggField & Leibacher Biber-Manufaktur. #FoodTech is a topic which has accompanied Silvan for years. He is working on new approaches in the food production value chain, which are urgently needed nowadays. One of his worldchanging projects we would like to highlight is the "egg substitute for the food industry". He manages to combine tradition with innovation and fearlessly bold is his guiding principle: "simply do it".
First of all, tell us something about yourself: Which hashtags describe you the best? I would choose #simplydoit, #foodtech, and #leibacherbiber as hashtags, and of course #eggfield.
Tell us more about them. For me, the idea of “just doing it” is a declaration of love for trying things out and tackling possibilities instead of over-thinking things. It means coming to terms with imperfections and failure on a small scale and courageously daring to do things, taking risks and launching new projects. Of course, I don’t always succeed – but I like this approach a lot in principle. #foodtech is a topic I’ve been thinking about for years. I’m fascinated by new approaches in the value chain of food production and believe they are urgently needed. It takes a lot of resources to produce food for eight billion people. And the production of animal-based foods alone emits more CO2 than the use of all cars, planes and ships worldwide combined. Technology and creativity are very much in demand when it comes to rethinking our food systems.
#LeibacherBiber and #EggField are the two projects that take up the most time at the moment and allow me to be my entrepreneurial self.
Let’s talk about your professional life: What do you do at Leibacher Biber-Manufaktur and EggField? I am a co-founder of both companies, although the idea for EggField came from Leibacher Biber-Manufaktur while I was studying at HSLU.
At Leibacher Biber-Manufaktur, I have been developing strategy, finance and marketing concepts over the last twelve years. Last year, I handed over the marketing department to my sister so that I can dedicate more time to EggField, my second company. When we founded EggField in the spring of 2022, I assumed the role of CEO.
What did you do before that? After my commercial apprenticeship in the media business, I studied business administration before switching to Unilever. From there, I moved on to an online marketplace to learn about how the world of food and consumer goods works.
Let’s turn to your project: Please tell us about it. Leibacher Biber-Manufaktur is all about showing how you can create delicious baked goods by combining tradition with innovation. My siblings and I founded the company in 2010. Biber is a filled gingerbread and a traditional Swiss speciality. In recent years, we launched the Biber product with all our innovations in plant-based versions and by relying on established as well as innovative production methods. We set ourselves the goal of creating unusual products of a high quality made as sustainably as possible from regional raw materials. This is what our LEIBACHER brand stands for today.
The search for innovative ingredients has also led us to come up with the concepts for EggField. It took us a long time to find a plant-based alternative for eggs that is sustainable and suitable for our recipes. While looking for a solution to this problem, I met David Ebneter, who was working as a food technologist at a university at the time and had a lot of experience with plant extracts. Together we developed a plant-based egg substitute that worked well and could meet our needs and requirements. When we realized that many other bakeries also had trouble finding a good egg substitute, we further developed our product – with Melanie Binggeli, an agronomist and Pioneer Fellow at ETH at the time, as well as with the Bern University of Applied Sciences and Swiss Food Research – brought it to market, and gave it the name EggField.
Today we already have seven employees, including David Ebneter, Riet Steiger and myself as co-founders. This summer we were able to wind up an initial round of financing.
What data do you use, what methods do you apply and what insights have you gained or hope to gain? Data is very important when it comes to developing and producing food, especially egg substitutes. Besides taking and evaluating samples for how long a product keeps, we want to make sure it remains functional if the quality of the raw materials should change. At the same time, we are working hard to further develop our products. There is little research so far on how plant proteins behave, something where I see a lot of potential – also with the use of new data processing methods. For example, this means testing a wide range of raw material combinations and then optimizing existing products and developing new ones.
How do you think your findings can help society?
Using plant-based rather than animal-based ingredients in food production makes a lot of sense from an ecological and ethical point of view in almost every case. Processed items such as pasta, cakes and sauces are not consumed because they contain animal components but because we as consumers like their taste. In the case of eggs, half of all eggs are turned into other products, and often these eggs come from an unsustainable and animal-unfriendly operation.
When we use substitutes in these products, we save large amounts of CO2 and at the same time reduce ethical concerns and lower the health risks associated with mass animal farming. In terms of taste, you don’t notice any difference – as a rule.
How are you looking to develop your project further? We are working on scaling up production and bringing the product to the Swiss catering industry. So far we have already produced over 4,000 kg of egg substitutes. Our aim is to replace a large share of all the processed eggs with better, more sustainable ingredients.
We need to learn more about plant proteins to understand how they can help us feed more people more sustainably and thus preserve our ecosystems.
How did your studies (MSc in Applied Information and Data Science) influence the project? We launched EggField while I was still at HSLU. Contrary to the questions surrounding Leibacher Biber-Manufaktur, EggField was always a tech-driven project. Eggs have many uses during the various application steps: whether you’re making meringue, quiche or mayonnaise, eggs have many functions that can be measured, evaluated and mapped. Before we started with the idea, David tested countless types of pulses and evaluated their suitability as a basis for an egg substitute. For some of these tests, our HSLU lecturer Matteo Tanadini helped us with evaluating the data, something that was very helpful for us in assessing the initial results.
After pursuing the project for the first few months while I was in the MA program on data science at HSLU, EggField took up more and more of my time as our customers started to become interested in our work. That’s why it became clear to me in the course of the year that, as much as I had enjoyed my time in Lucerne, I had to put my studies on hold after three semesters. So, I’m content – at least for now – with a having “half” an MA at this point.
The semesters at HSLU have shown me how data can help me deal with the challenges and questions I’m facing and how a data-driven approach can help me solve problems. Especially in the food-tech sector, there are many applications and lots of potential in collecting and evaluating data in a structured manner.
What advice would you give others who are starting a project? There’s always a lot that you can’t plan. That’s why it’s worth trying things out and not just spinning ideas in your head. It takes stamina and courage, and always a fair amount of luck.
And finally: What new hashtag are you aiming for in 2023? Moving forward doesn’t always depend on making huge leaps. Rather, it’s often a matter of taking small steps in the right direction that will help your project to move forward and hopefully take off. So, I’ll go for #alsosmallstepscanleadtothegoal.
Hack your Brain: creating an audio-immersive literature experience
Data Science is usually used in industries such as finance, marketing, and maintenance. Why not use it in more creative domains? Data Science should be relevant in arts, this is what Maison du Futur thinks. Therefore, four part-time “Applied Information and Data Science” Master students, together with Professor Peter Gloor, are building an audio-immersive literature experience using face recognition and brain wave data for Maison du Futur.
This audio-immersive literature experience is made possible using the brainwave measuring tool Emotiv Insight and further code which is developed for this purpose. We proudly present the HSLU Data Science project & research team:
Data Science finds more and more fields of application, also the art sector is getting interested in it. Together with Maison du Futur, it has been decided to plan an experiment, where the faces and brainwaves of the participants and their emotions will be recorded to measure the effect of “resentment”, expressed through spoken language and referring to an “object” (here: a book) on a recipient’s emotions.
Maison du Futur is a national innovation center for the arts, where all forms of audio-visual and performative storytelling are developed and presented in combination with new technologies, such as Artificial Intelligence, Augmented Reality, and Big Data – and we were taking part in it. After an intense preparation phase, the experiment took place in Zurich and the data could successfully be tracked and is ready for further analysis in the next semester. As our society becomes more and more individualistic and people are used to being treated individually, especially online, this field of study is very interesting.
The Preparation
The most significant part of this research was to collect enough brainwave data to develop a model. Friends, family, and colleagues were invited to take part as test subjects and let us “borrow” their brains with the help of the Emotiv Insight measuring tool. This device measures activity in all cortical lobes of the brain, providing in-depth information typically found only in research devices. We did not miss the chance to also test the device on our heads.
Our test subjects, including ourselves, watched an approximately 10 minutes long video by COIN’s Personality Prediction Project which triggers different emotions, such as happiness, anger, disgust, sadness, and neutrality. Data was collected not only with brain waves but also via face recognition. So, at this point, data about their emotions recognized by face and real-time display of raw Electroencephalography (EEG) and performance metrics were available.
An electroencephalogram records the electrical signals of the brain by using electrodes that are attached to the scalp. Brain cells communicate with each other using electrical impulses and brain activity will show up on an EEG recording as waves. Six basic measures of mental performance (engagement, excitement, focus, interest, relaxation, and stress), derived directly from mental activity. Each measure is automatically scaled to suit the normal range and base level of each condition. Now different models could be built.
Measuring Emotions through Brainwaves / Hack your Brain Project
Emotions of the brainwave data were matched with the expected emotions from the face recognition and then labeled. With the help of Deep Learning, a model to recognize emotions was built. A Long Short-Term Memory (LSTM) network was chosen which is a type of recurrent neural network. LSTM is capable of learning long-term dependencies in data. Promising results were found during the training phase of the model with high accuracy. In case our model would not be accurate enough in the new setting, we decided to add additional emotions collected by face emotion detection. Thus, new approaches had to be taken. Luckily, we were also able collecting emotions from face detection.
Emotions of the brainwave data were matched with the expected emotions from the face recognition and then labeled.
With the help of Deep Learning, a model to recognize emotions was built. A Long Short-Term Memory (LSTM) network was chosen which is a type of recurrent neural network. LSTM is capable of learning long-term dependencies in data. Promising results were found during the training phase of the model with high accuracy. In case our model would not be accurate enough in the new setting, we decided to add additional emotions collected by face emotion detection. Thus, new approaches had to be taken. Luckily, we were also able collecting emotions from face detection.
The Data Science Experiment
The day of the experiment was here. Again friends, family, and colleagues were brought together to collect more insights about their emotions – but this is not all.
At the Max Frisch Bad, each experiment participant was brought to a room marked by literature. They were set down on a chair, facing two books – one supporting feminism and one opposing it – both written by women. The books were set in dark lighting to not put too much attention on them. The measuring device was carefully installed on their heads – sometimes with more hassle than intended, depending on the person’s hairstyle. Calming music started for the introduction phase in which the person also was asked to read two articles about the feminist and anti-feminist female authors.
After the 5-minute introduction phase, an emotionally loaded audio reading by the Swiss author Robert Walser’s “Der Spaziergang” was played. The audio reading was about a specific scene in a bookstore, in which the protagonist was really opposed to a certain book, which was not named. After enough suspense has been built, THE BOOK was lit up in front of the subjects. The lit-up book was the one mentioned in articles, which was very affirmative to feminism. The same reading, but in a neutral voice, started again and this time the anti-feminism book was lit up.
IMAGE ABOVE: THE EXPERIMENT PROCEDURE / IMAGE BELOW: EXPERIMENT IMPRESSIONS
23.12.2021: The Experiment Some impressions of the experiment “creating an audio-immersive literature experience”, taking place at the Max Frisch Bad in Zurich. Subsequent to the experiment, a survey looking for the participant’s political orientation was handed out.
The goal was to see, if they would react differently to the two books which were highlighted, depending on their political orientation. Thereby, for the emotionally loaded audio stronger emotions were expected to be measured.
The Future
With an initial analysis immediately after the experiment, the data-based evidence showed clear results. The version with the angry audio and pro-feminism book provoked more emotional reactions than the second version. However, the data also indicates that these emotions were triggered less by the provocative book and more by the speaker’s tone of voice. The point, at which the voice tips into shrillness is clearly visible visually, opposed to the point when the book was lit up.
Through deeper analysis of the recorded data and a further development of the algorithm, more subtle emotional reactions, such as in our example the feelings caused by a polarizing book, the political attitude or the influence of the setting, should become detectable in the next step. For us, the most exciting further development of the project also lies in this direction.
The detection of emotions with EEG data still has a slightly futuristic touch. Especially outside of laboratory conditions and standardized data sets. And this is precisely, where the greatest appeal of this project is: exploring new ideas at the intersection of data science, art, and emotions, without knowing exactly, where the journey will lead. Maison du Futur in their role as artists “producing” emotions and experts in the search for something new, were of course a perfect partner in crime for this experiment.
The fact, that we learned something about literature in addition to neural networks and brain waves, was more than just a pleasant side effect. And that such partnerships between art and data science are more than just fun. The fact that they are also highly relevant outside of term papers is no longer a secret, at least since the buzz of AR, VR, and Metaverse.
Continuation of the Project – Part 2
In the meantime, the student team has worked another semester analyzing the data collected from the experiment. Their main insight was that when the participant was listening to the angry voice and shown the pro-feminism book, it provoked more emotional reactions than a calm voice and showing an anti-feminism book. However, the data also indicates that these emotions were triggered less by the provocative book and more by the speaker’s tone of voice.
The point at which the voice tips into shrillness is clearly visible visually, while the point when the book was lit up triggered much lower emotions. Thus, by deeper analysis of the recorded brainwave data, it was shown that different reading styles decisively influence the emotions of the listener. This was tentatively confirmed by comparing brainwave data with face emotion data of the listener. In conclusion, this project illustrates that using EEG for the detection of emotions provides a valuable new tool for enriching and improving audio art project installations.
The three figures above illustrate an overlay of emotions over time for the angry reading (red) and the calm reading (blue) for three study participants.
Data Science: Hackdays Challenge – Data Science Meets Football
The painstaking process of coding (20 hours!) has finally come to an end. You press the “Enter” key, the whole team holds its breath… and it works! The algorithm accurately maps the present and predicts the future – hopefully, also precisely. Magic? Applied Data Science!
Sport Hackdays aimed to use Data Science to the benefit of the sports industry. Master students of the Applied Information and Data Science programme came together with the representatives of the sports industry to develop state-of-the-art solutions to the current challenges.
Football Players Profiling Challenge
Selecting the right person for the right job is an important task in every field. But in team sports such as football, finding people with complementary skills is the most crucial ingredient for success. Research shows, that coaches and places cannot notice or remember more than half of the relevant actions that happened during the game (Sport Performance Analytics, 2018). With the growing application of data analytics in sports, data-driven insights can help the coach staff and players to achieve optimal results on the football field.
During the Sports Hackdays, the “Player profiling” challenge aimed to develop an algorithm for analysis of the footballers’ performance. With this knowledge, the challenge owner, the Servette Football Club from Geneva, will hopefully be able to win the Swiss Super League for the first time since 1999.
The team consisted of FC Servette staff, FIFA certified football scouts and three Master students. First, the team prepared the data: performance statistics of 5 European Leagues and Swiss Super League data for the year 2020. The information included 48 features, such as the number of shots, penalty wins, key passes, percentage of successful dribbles, etc. The data was scraped from fbref.com – a great source for football analytics.
Starting to play around: Data Exploration
In order to identify the distribution of data, the challenge team explored and analysed the data to find the outliers, etc. Turns out, there are a couple of “problem children” – footballers who, for some reason, show very strange behaviour on the field. For example, according to the database one football player – we will not mention his name – has managed to receive two red cards in one match. It is virtually impossible, but this finding has proved – once again! – that it is extremely important to diligently prepare the data.
Data exploration is always a thorough and time-consuming process (Figure 1)
Advancing: Insights extraction
Once the data is prepared, it’s time to start the analysis. The scout and the Servette FC representative have defined the performance characteristics of players’ roles. Based on these characteristics, the players can be grouped into performance clusters (the k-means clustering method was used for this). For example, the Striker player role has six clusters: Scoring chance generator, Target Man, Finisher, Selfish & Risky, Dribblers, and Efficient attacking Creator. The FC Servette strikers can then be assigned to these clusters (Figure 2).
Mapping the Servette players to the Striker clusters (Figure 2)
Conclusion
The heatmap in Figure 3 shows the “importance” of each performance variable for the given cluster on a scale from 0 to 1. For example, the “Efficient attacking creator” usually has high numbers in many characteristics such as “Carries”, “Successful crosses”, “Assists”, etc. The “Target Man”, on the contrary, shows supreme performance in fewer characteristics – for example, in “Deep progressions” and “Aerial wins”. The information can help the coaching staff in planning training routines of the players, showing the areas to focus upon for each player profile. At this point, the team focused on visualising the data guided by the belief that a Data Scientist needs to present the information in a way that can be easily understood by the target group.
The heatmap of variables importance for each cluster (0-1) (Figure 3)
Another data visualisation helps to compare the clusters in terms of their key characteristics (Figure 4). The player with the “Efficient attacking creator” profile has a higher number of OP assists than the Finisher.
Comparison of the Finisher and Efficient attacking Creator profiles (Figure 4)
Final: Delivering the result
Based on the developed algorithm, Servette FC can scout and acquire players with complementary skills. For example, if the performance data shows that the European Leagues are won by the teams where strikers match all six afore-mentioned profiles – then the Servette FC coaching staff should either train its footballers accordingly or look for players with respective skills. At the end of the Hackdays, the Challenge team presented this solution to the jury and the fellow Hackdays participants. Although the group did not win, it was a great experience nevertheless. Coming together with a group of people with different backgrounds, and trying to solve a problem in a very limited time, is a valuable opportunity to grow and to push your skills to another level.
Homework: Improvement plans
Naturally, in the limited time available, the team did not manage to realise all plans. Some ideas are yet to be implemented. For example, only one clustering method – k-means clustering – was tested during the Hackdays. It would be interesting to see the results of other algorithms. Another important improvement is to integrate information about changes in the team strategy and coaching approach. This will distinguish between the player’s individual behaviour and the strategic directive he receives from the coach. Likewise, incorporating game event data allows one to observe under which circumstances the player performed in a certain way: maybe it was caused by the style of the competing team?
Conclusion
The challenge aimed to assist Servette FC in defining the profiles of their players. In the future, the improved algorithm will allow the football club to have an overview of their athletes performance, plan its scouting activities and better develop the players potential based on the target profile. As a Data Scientist, it is important to have an opportunity to apply your technical skills in a new field and to test different opportunities of applying the algorithms. In this situation, the domain knowledge – that is, awareness of the field you analyse through machine learning – cannot be underestimated. This is why Data Science can be seen not only as a separate job. It is also a set of skills that can be acquired by people with different backgrounds for the benefit of their domain, be it sport or medicine.
Professional Data Science portrait with Cornelia Gruber: Digital Solutions Engineer
Our former HSLU and Applied Data Science student Cornelia Gruber spends her challenging workday in Barcelona at VMware in the role of a "Digital Solutions Engineer". The hashtag #goforthegoodlife! aptly describes Cornelia in her fun-loving nature. In addition to Data Science, she loves the finer things in life such as coffee, music and theater. Her goal is to constantly develop and strive for the best version of herself. Read more about Cornelia's professional life and exciting review of her studies with us.
First of all, tell us something about yourself: Which hashtags describe you the best? #goforthegoodlife! and #everythingisrelative
Tell us a bit more about them: Life isn’t always easy, and we can’t control much of what happens to us. But we can always keep a sense of humor and stay flexible. I think we should make those things in life that are in our control as enjoyable and fun as possible.
What I mean with #goforthegoodlife!: Find out what makes you happy and what you really enjoy, see as much of the world as possible, and never stop being open and curious – and to learn, think critically and make time for the beautiful little things in life. Good coffee, loud music, theatre, nature, Hermann Hesse, and wreck diving are at the top of my list 🙂 For me, this also includes constantly developing and striving for the best version of myself. You have to realize your goals and dreams now – change never happens by itself.
#everythingisrelative is my view of science and epistemology, a mix of categorical imperatives and critical rationalism that has shaped my whole life. Natural science essentially is about operationalizing: Making things measurable always means seeing them in their context. Therefore, we can only ever make probability statements that have fuzzy borders and an error likelihood proportionate to their context and to the scale we’re using. Science can answer only those questions that we ask, and we have no way of ever knowing whether they were the right ones. In other words, everything always remains relative.
Now let’s talk about your professional life: What do you do at VMware? I started there in Barcelona this year, as a Digital Solutions Engineer Graduate in the Digital Sales Center for Europe. It’s a graduate programme in which future VMware solution engineers from all over Europe can optimally grow into their roles. As solutions engineers, we are our customers’ trusted advisors and help them to find the right technologies and solutions for their needs. This of course means having good technical knowledge of VMware’s solutions, because we have to explain and demonstrate them in customer calls and select the right ones for each customer from a pretty large range of options. They include solutions for data center virtualizations, end-user computing, hybrid/multi-clouds, virtual cloud networks and security, all the way to app modernization and Kubernetes. Learning about all this takes time and practice, which is why VMware has a graduate programme where we get lots of training and exercises to study the solutions and prepare for customer calls. And we have the opportunity to specialize in certain topics and become certified. Since it’s a graduate programme, we also have enough time and capacity for further education and personal development, among some other pretty nice benefits.
What did you do previously and why did you join VMware? After my BA in psychology, I first did an MA in neuropsychology but soon realized that I didn’t want to work as a neuropsychologist. I always wanted to be a neuroscientist and contribute to brain and consciousness research. I then became interested in brain-computer interfaces and neurofeedback, which made me really want to programme and learn all about AI. That’s how I ended up doing the MA in Applied Information and Data Science at HSLU. Studying psychology helped me to better understand how people tick and what it basically means to be human. While doing the MA in data science, on the other hand, I learned how the digital world around us is built and how it works. Not only that, but I also learned how our new tools and technologies can improve our life, why data is the resource of the 21st Century, and what enormous potential it harbors. I love data science and machine learning and am fascinated by computer science, cloud characteristics, containers, distributed systems and storage architectures, stream processing, data warehousing, and ETL / ELT concepts – everything that concerns data engineering and big data. At VMware, I can now apply everything I learned at HSLU at once because I’m in the company’s group for Machine Learning and Modern Apps and thus know the challenges of Data Science and Machine Learning that our customers as users face.
Tell us about the most exciting thing in your job. I don’t just work as a data scientist or as a data or machine learning engineer for a company in a specific field; instead, I can work on many levels with very different clients from different industries. I believe in the digitalization and democratization of AI and machine learning, and I can actively contribute to this field. Solution engineers also produce webcasts and train colleagues working in solution engineering and sales, and VMware has its own annual conference where we present innovations. In other words, I have a varied job profile, something that’s very important to me. And I like being able to develop myself independently in all directions. VMware also has a lot of partnerships, so as a member of the machine learning group I can attend NVIDIA conferences, for example, and learn about the technical sides of deep learning and GPUs.
Which data science skills are especially in demand in your job? Besides problem solving, I find everything about big data and advanced analytics to be incredibly relevant. At HSLU, we learned to become generalists in data science, which is exactly what makes this MA programme so perfect and sought-after. We pretty much did everything once: design thinking and data visualization, technical programming, building a data pipeline, training ML models, and tinkering with VMs in our own cloud. I think this is unique in an interdisciplinary MA programme at such a high level in terms of its technical and general content.
Do you think of yourself more as a techie or as an analyst? Or as a creative genius, management superhero or generalist wiz? That’s a tough question. I think I’m more the all-rounder, without the “genius” bit 😉
What do you remember the most when you look back at your time in the MSc in Applied Information and Data Science programme? This marks the first time in my studies that I really understand how our digital world actually works. I think what we learned in the MSc in Applied Information and Data Science programme is pretty much what holds the business world together at the core: from databases to integration of in real-time, from information from applications to statistical analyses of model-generated and data-driven predictions – we all are doing it because we all need it. I’ve always been fascinated by statistics, but programming, and especially Python, has taught me an awful lot about logical and analytical thinking. But my absolute favorites were the Big Data Labs, Data Engineering in the Cloud, as well as the specializations in Deep Learning in Computer Vision, and the NLP and Recommender Systems courses. For me, the whole last year of my studies was truly an intellectual paradigm shift, and I earned more credits than I would have needed because I didn’t want to miss any of the courses and inputs. And working in different groups, such as during the Hackdays, where we teamed up with Luzern60plus, as well as the opportunities we had to participate in the Open Data Science Conference in London, were absolute highlights. As you can see, I’m still excited about the programme. 😀
What are the biggest challenges in your job at the moment? VMware has defined company values as its guiding principles that we all need to follow. One of them is integrity, which means that we solutions engineers, as trusted advisors, must always regard our customers’ interests and challenges as the first priority. What I appreciate about VMware is how quickly and creatively it responds to new challenges that come about when our customer’s interests change and how it adapts its business models to meet those challenges. Trends in recent years have led it to expand its partnerships with all major public and countless small cloud providers and to offer subscription-based pricing models with universal credits for many fields. I believe that as long as you can identify such trends early on and respond to them, you can stay competitive.
What advice would you have for others starting in the same job? Build your networks, ask lots of questions, always keep an open mind, and stay flexible. In addition to being proactive, willing to learn and disciplined, I would also advise everyone to first take as many courses as possible on whatever topics are being offered, especially HSLU’s course on interview training for data scientists. After all, I think my LinkedIn profile was one of the main reasons why VMware found and recruited me – rather than me applying for the job. I would never have come up with the ideas for my LinkedIn profile and CV unless I had taken that cool course by the Propulsion Academy. So, thanks again for that too!
And finally: What new hashtag are you aiming for in 2022? I’d love to get back into some machine learning competitions and literary contests to challenge myself mentally. In my personal life, I want to finally make it to Komodo National Park to see the Komodo Dragon in real life. And to dive as much as I can 🙂
Many thanks to Cornelia Gruber for this interesting interview and the insights into your job and studies!
Start your career with the MSc in Applied Information and Data Science now! Register and join us for a free online Info-Event:


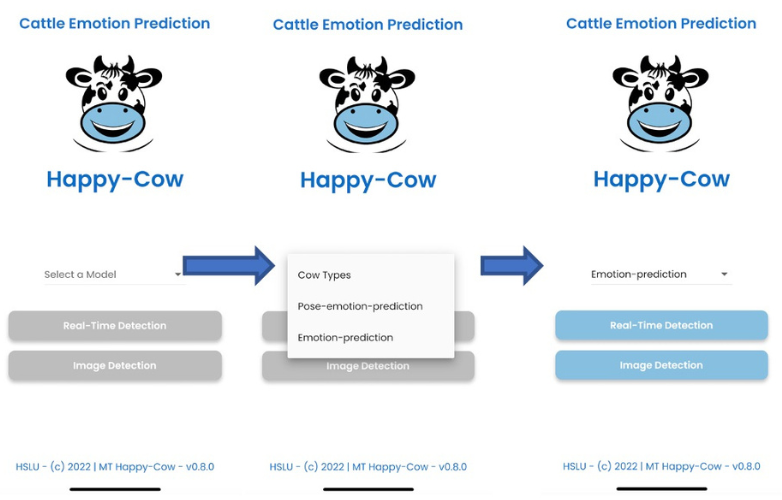


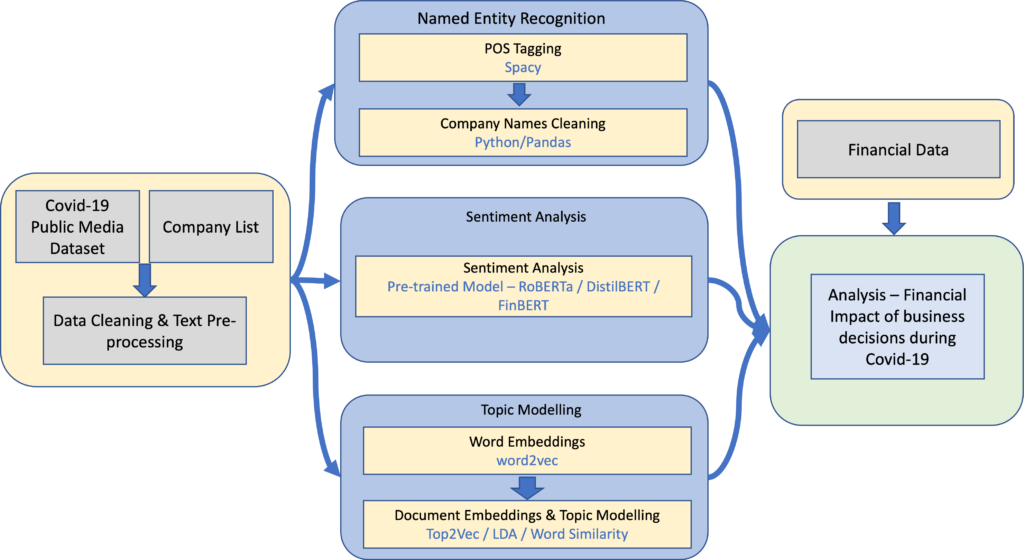
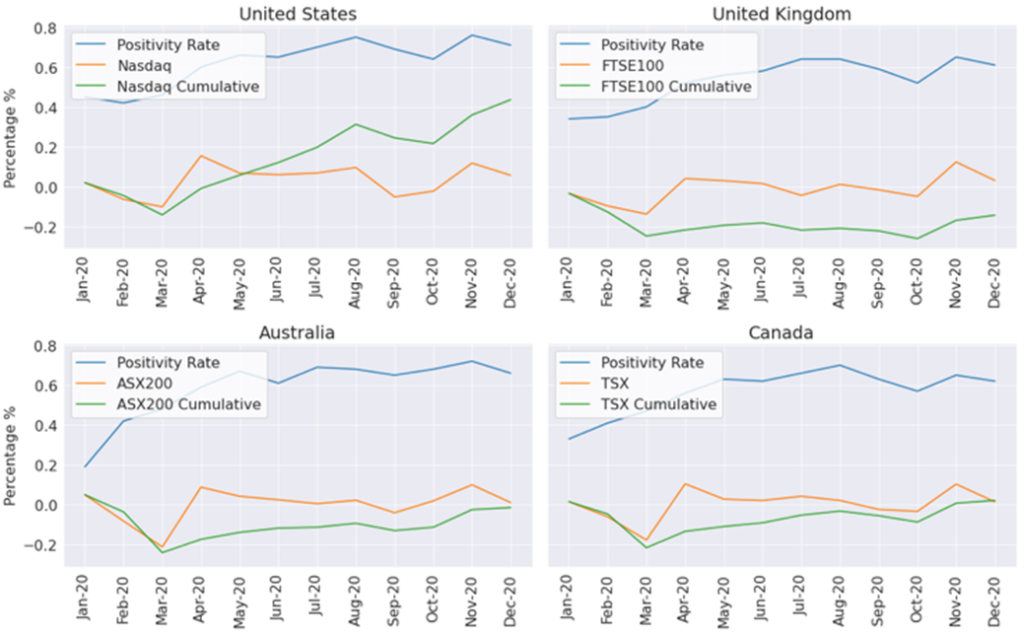
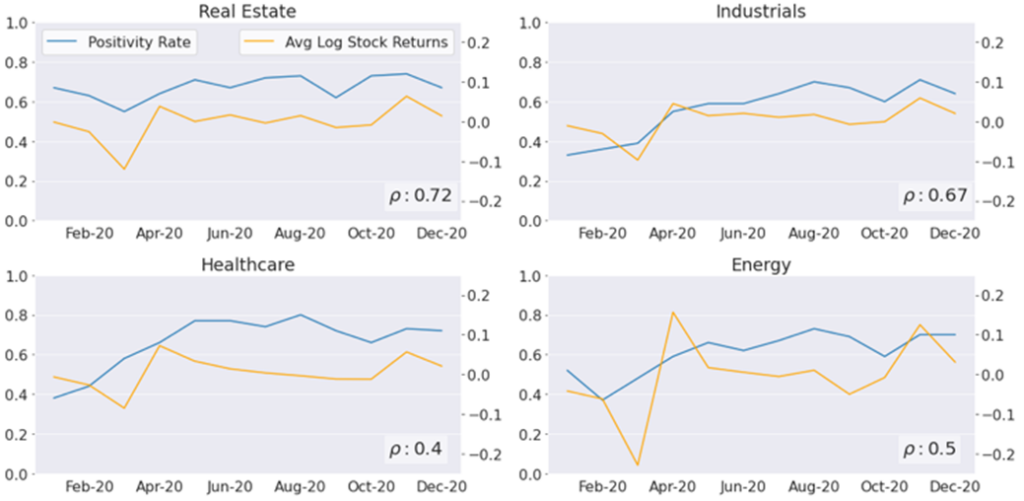


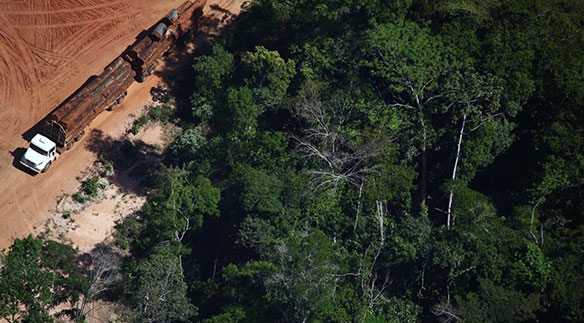

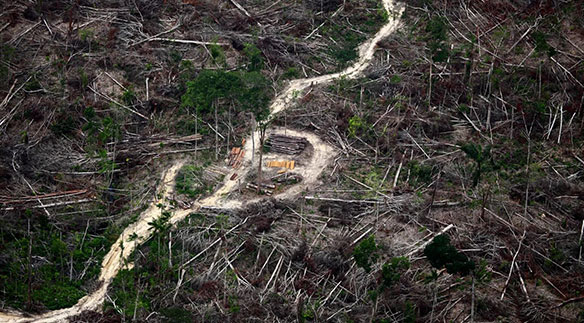
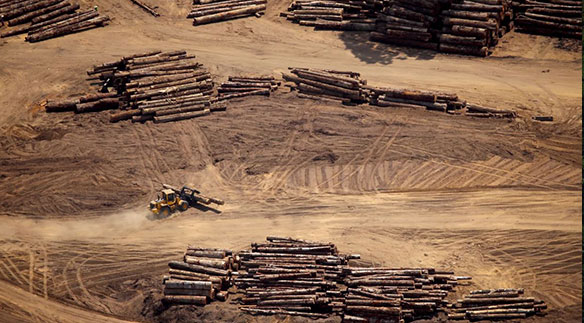
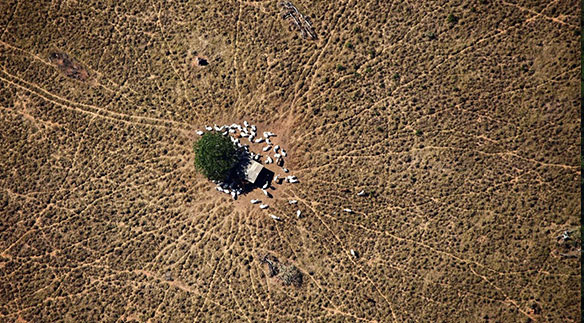
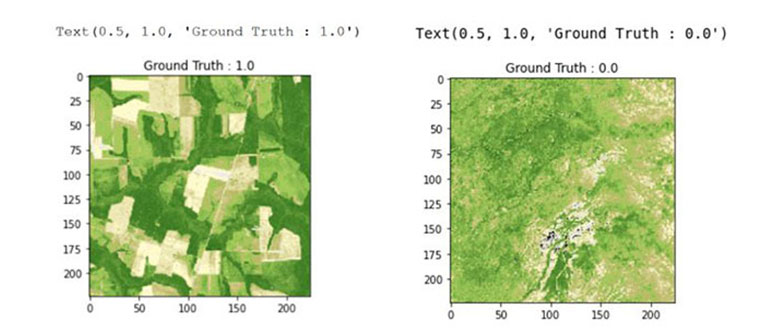
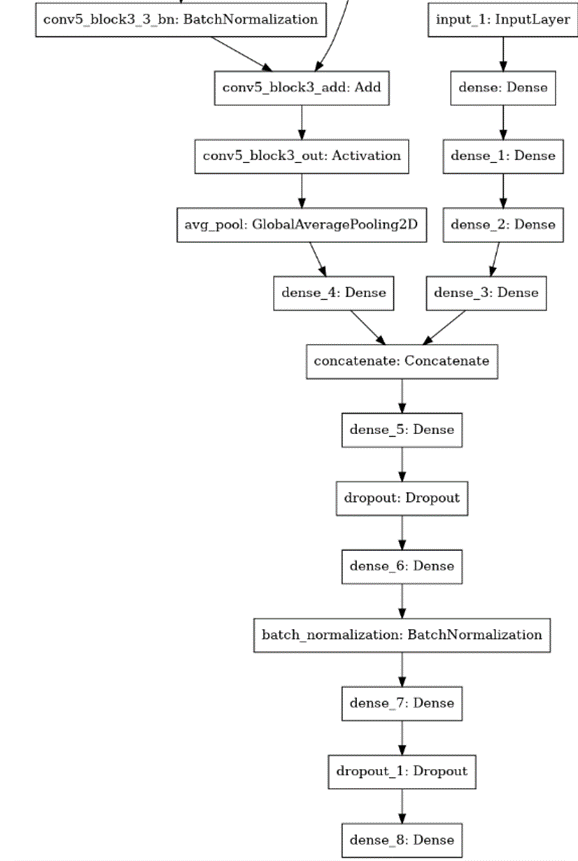
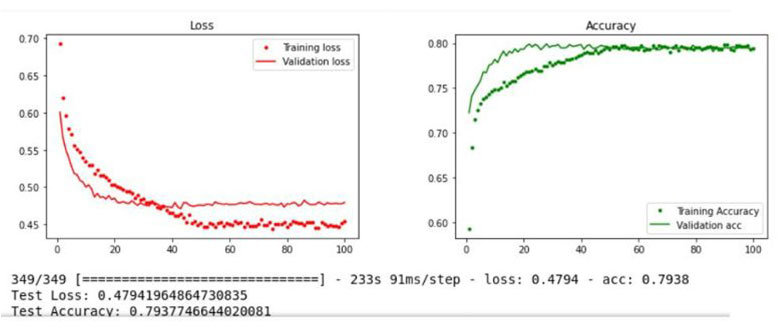
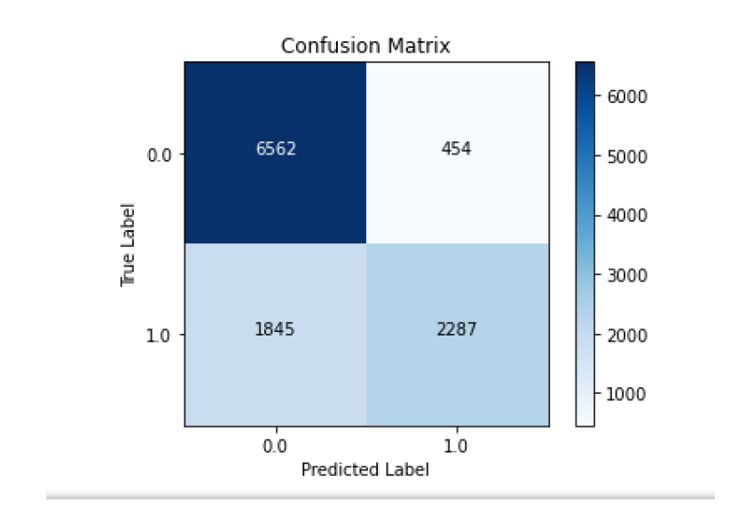
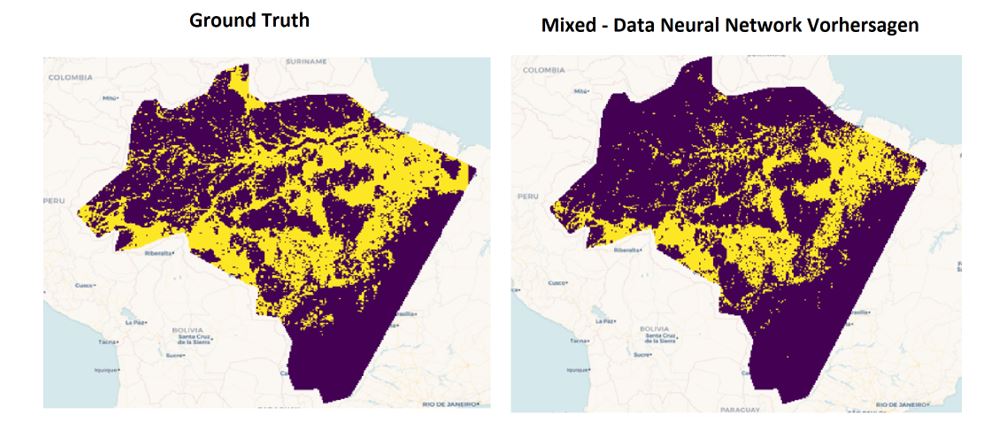
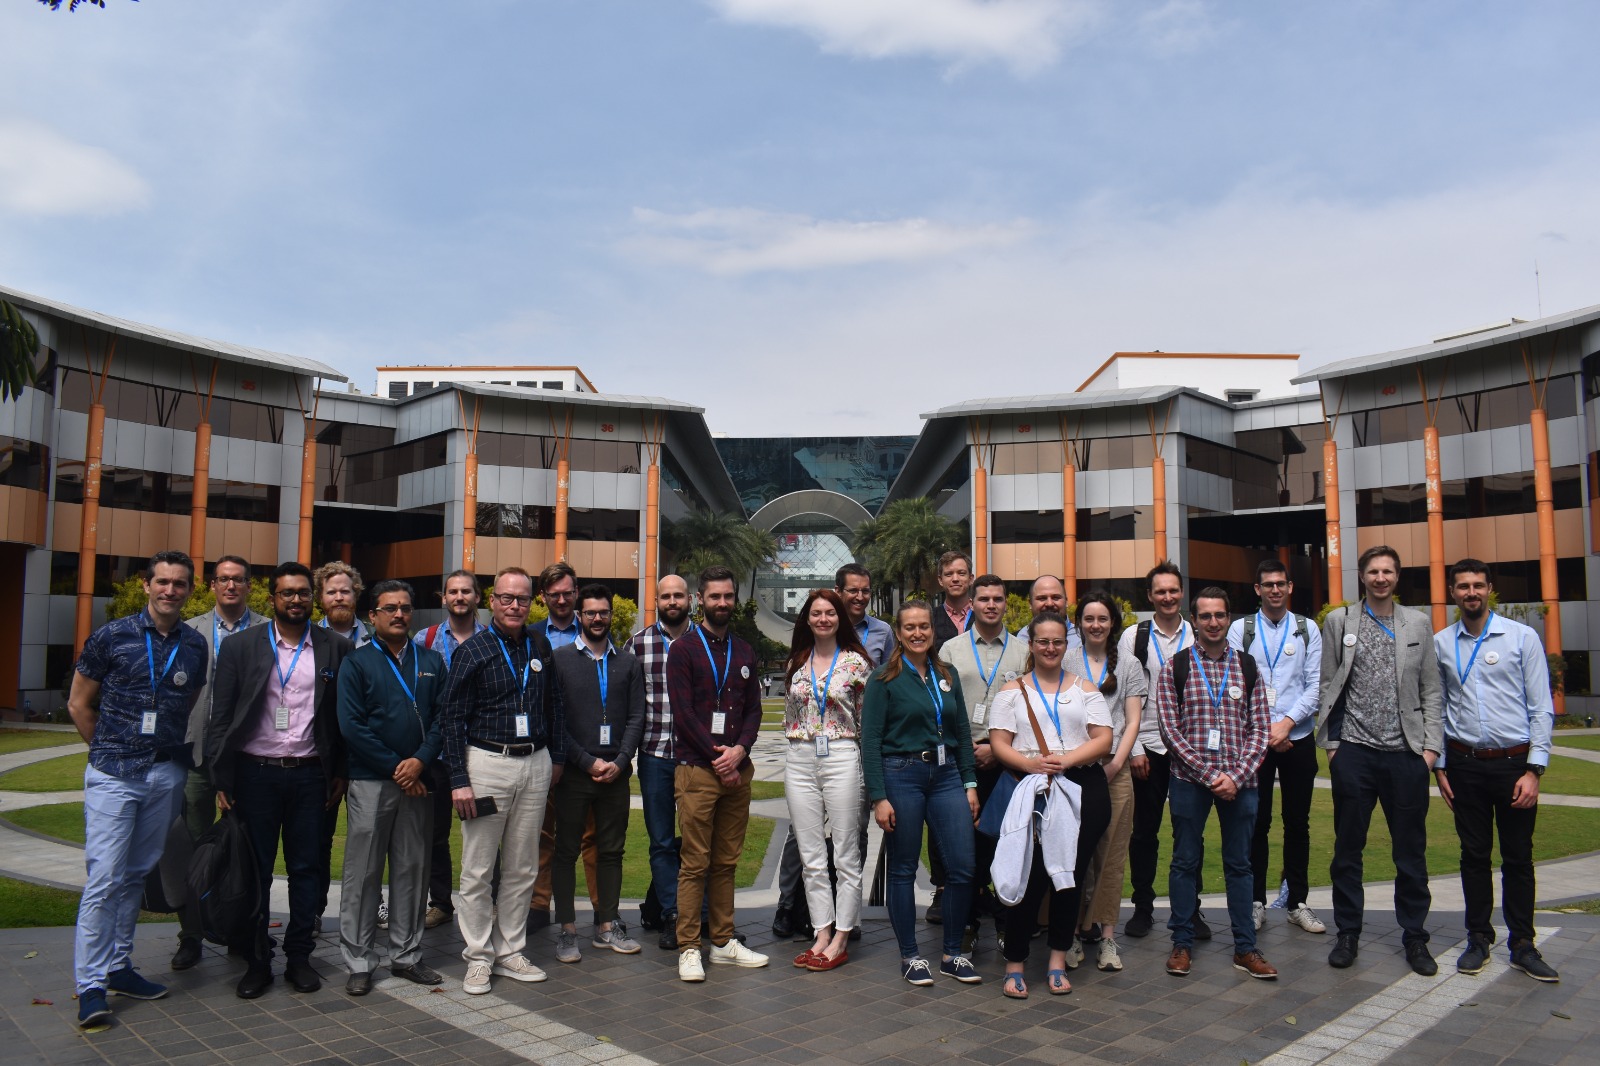

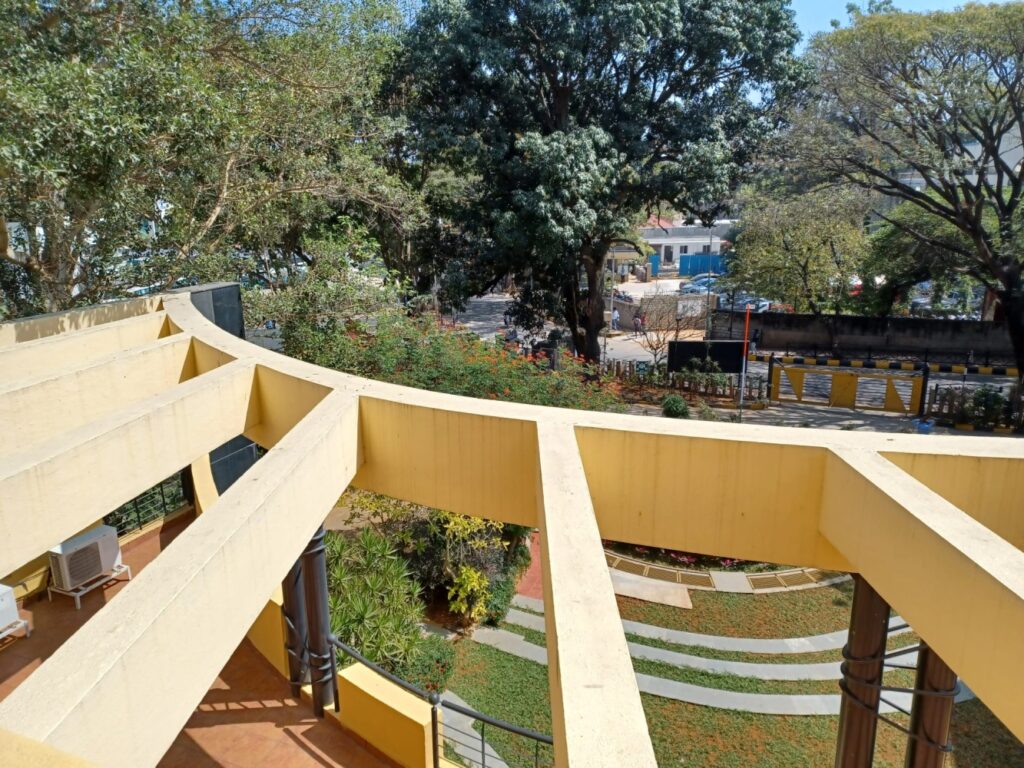
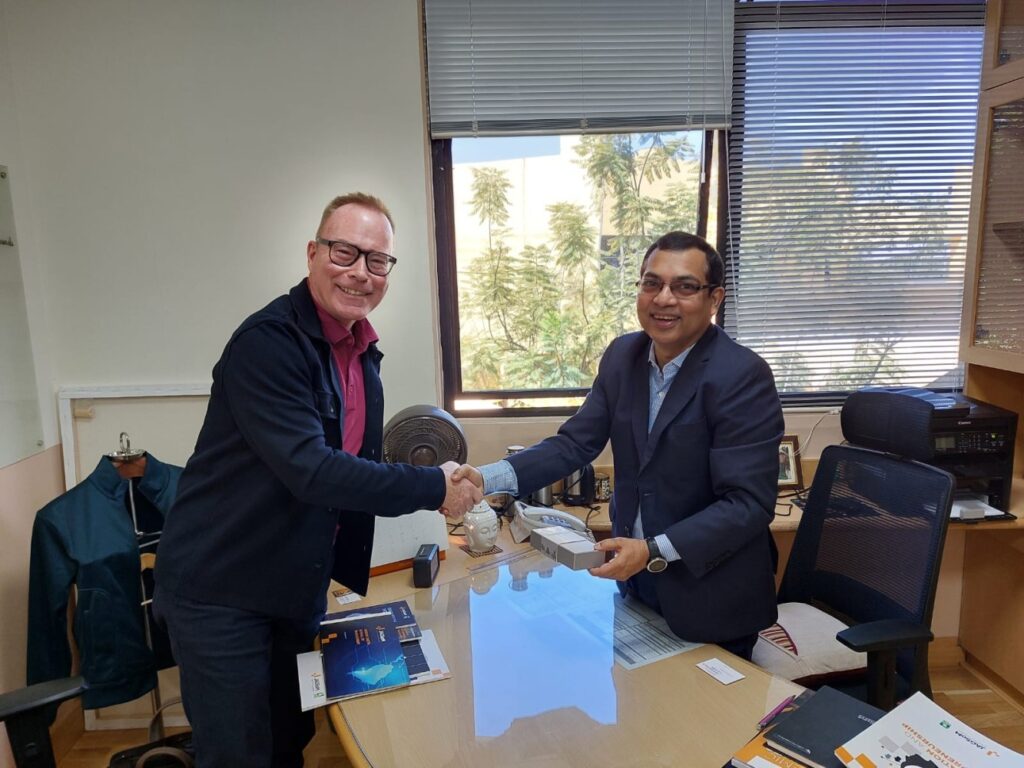
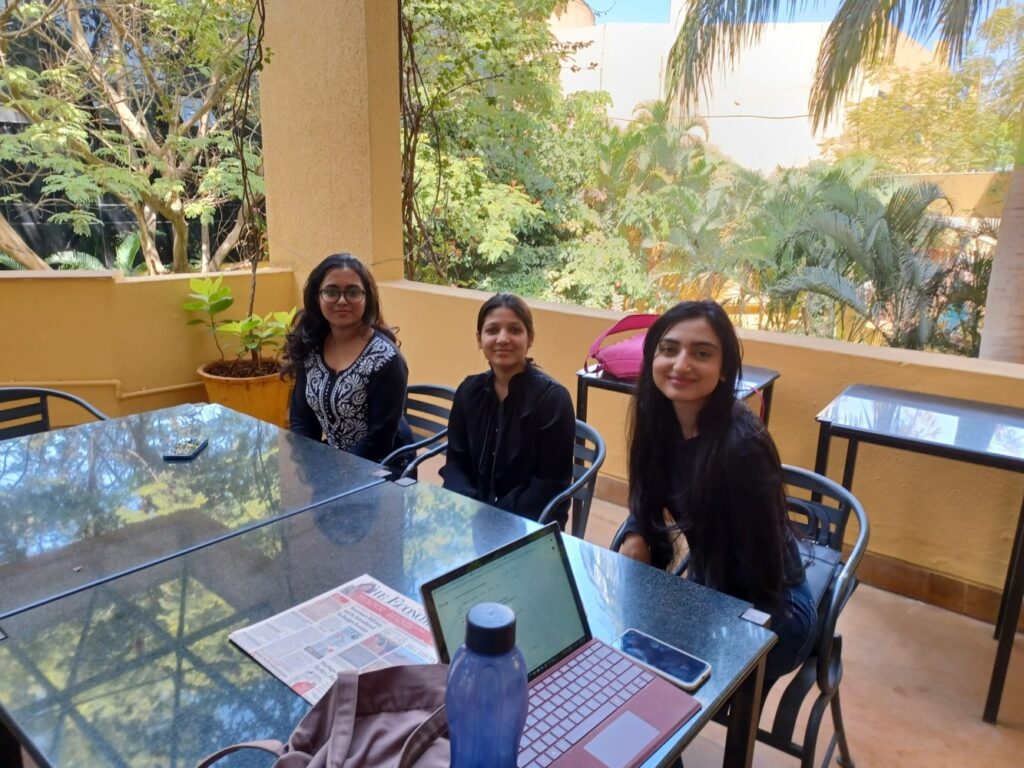

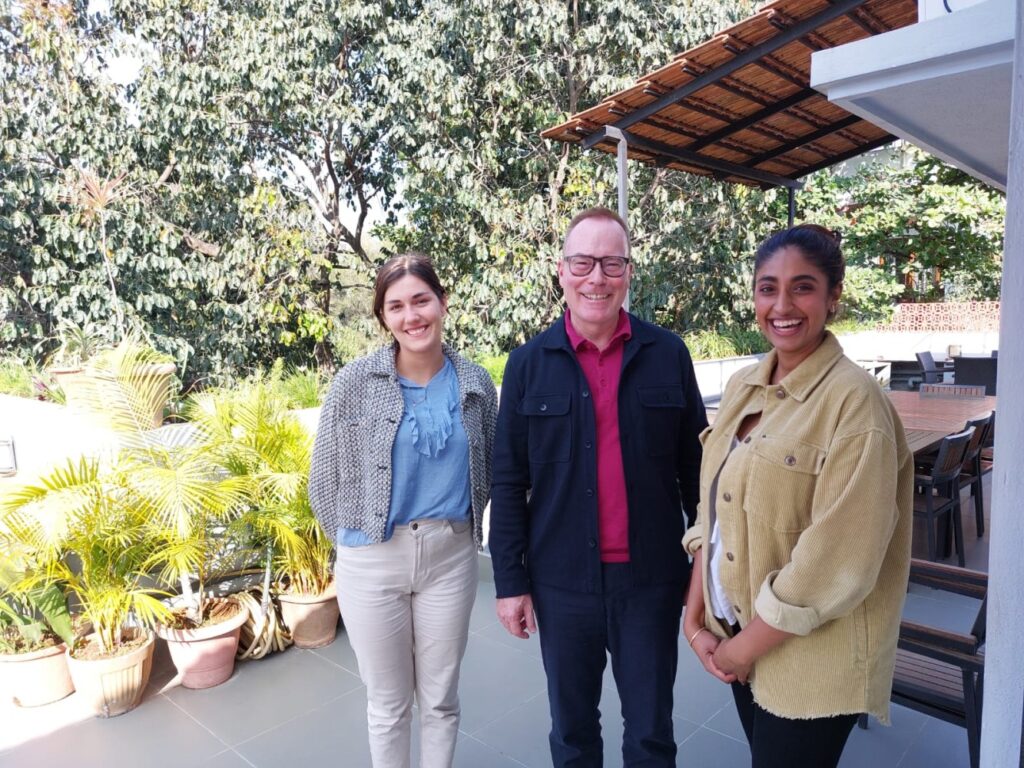
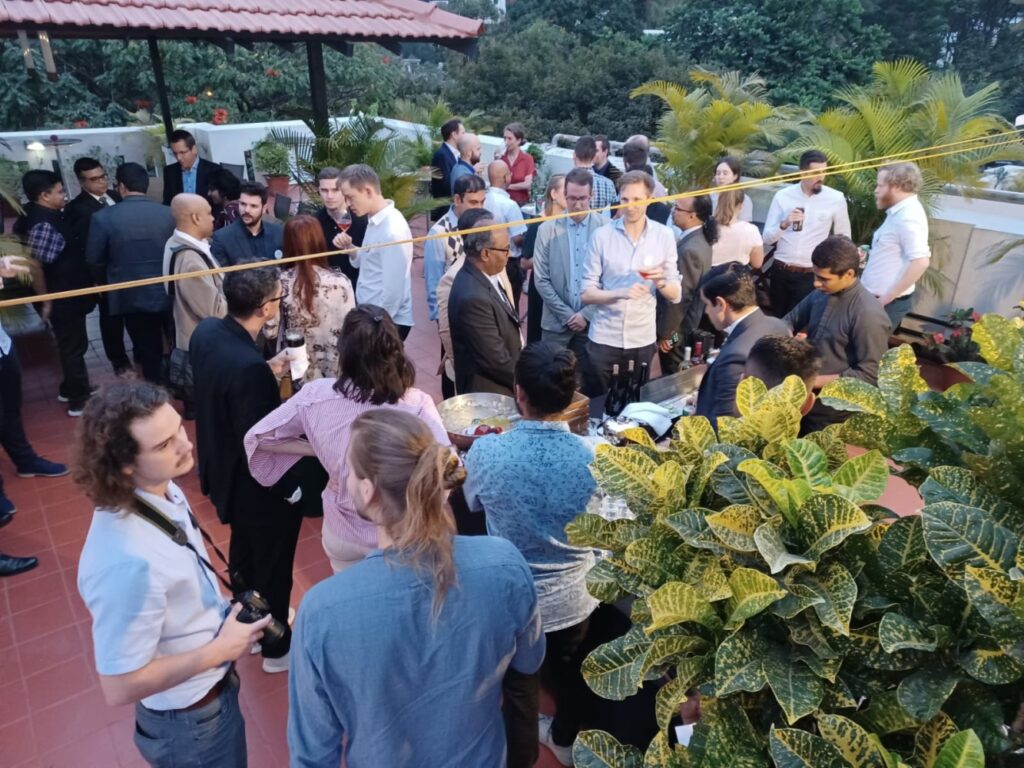
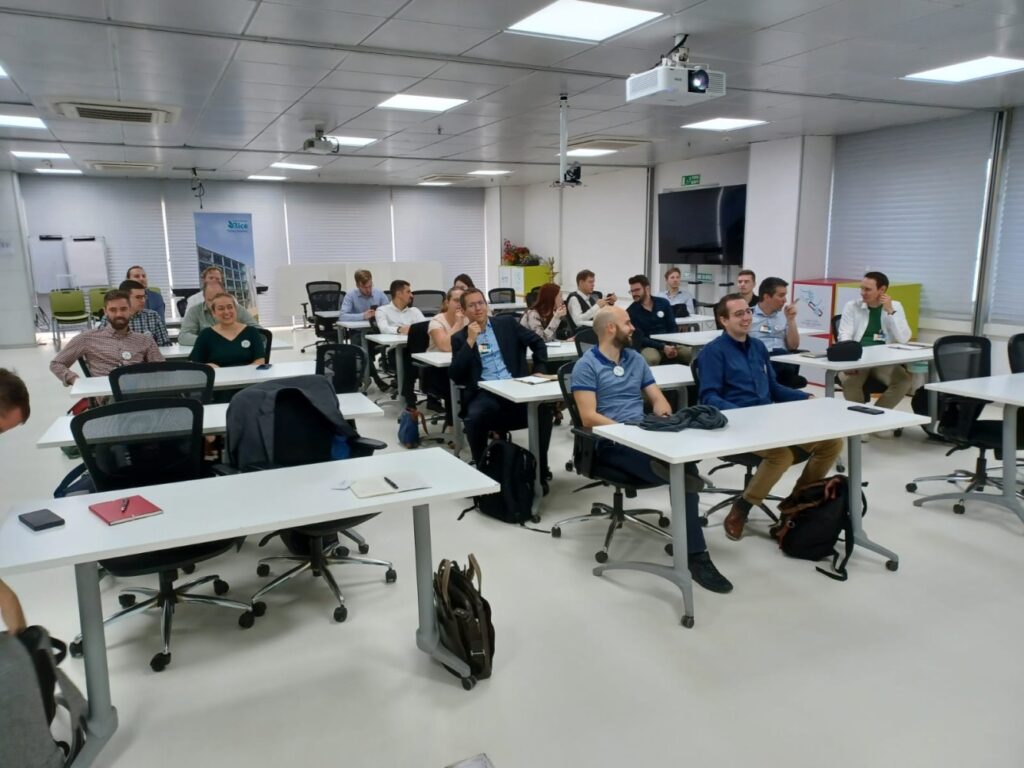
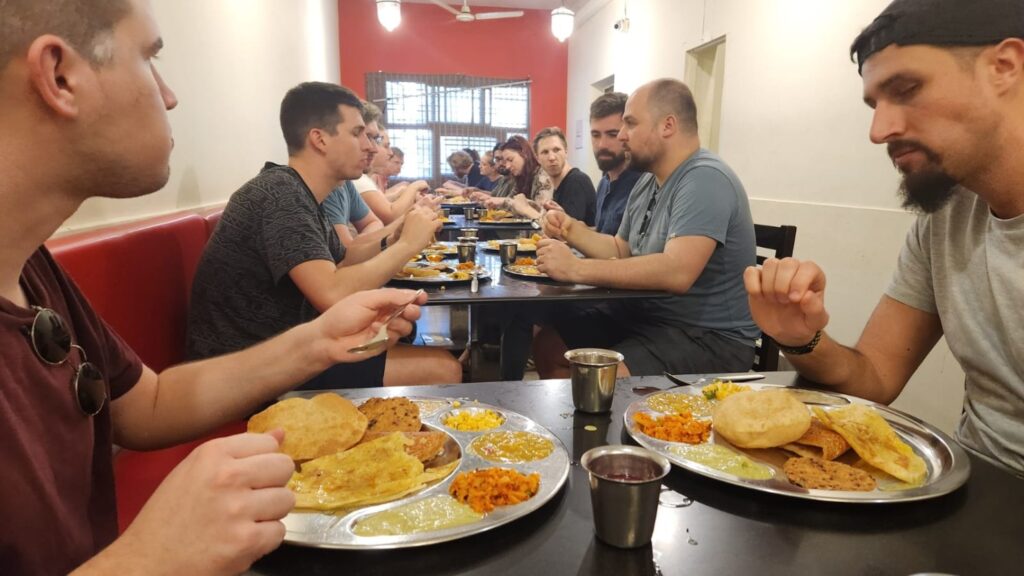

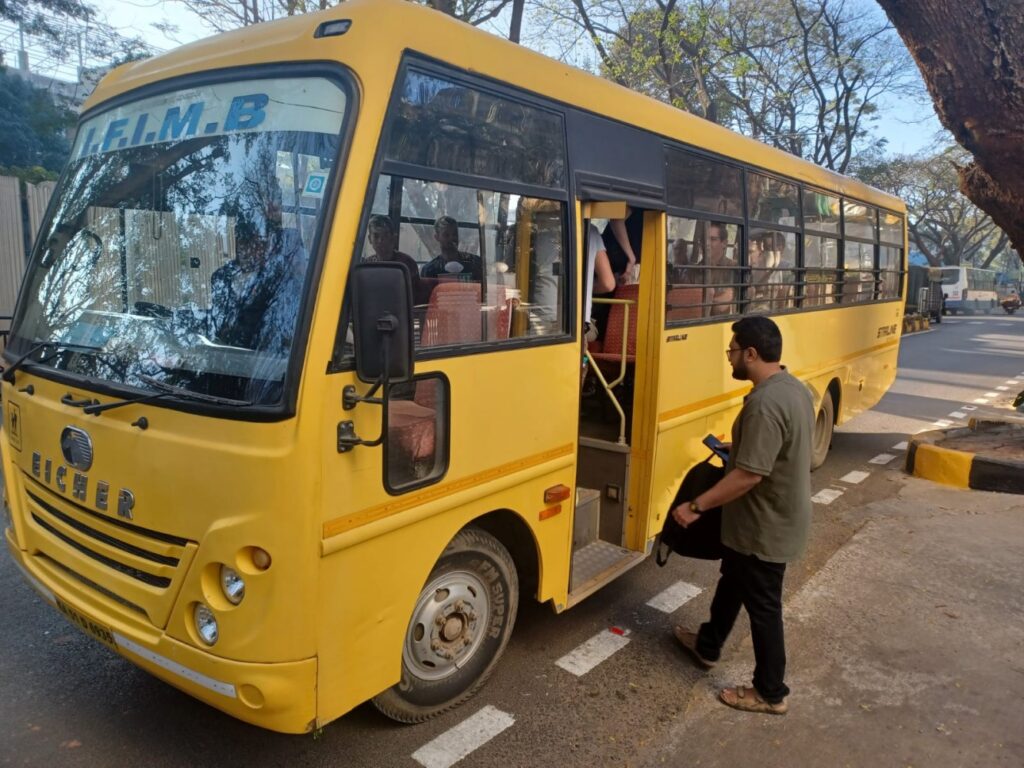

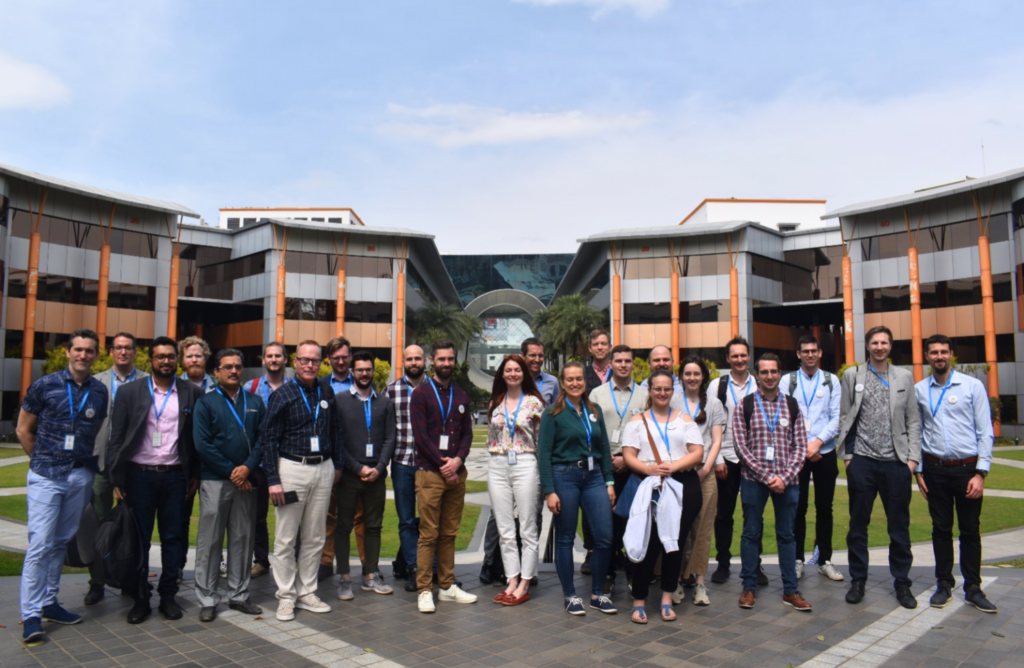
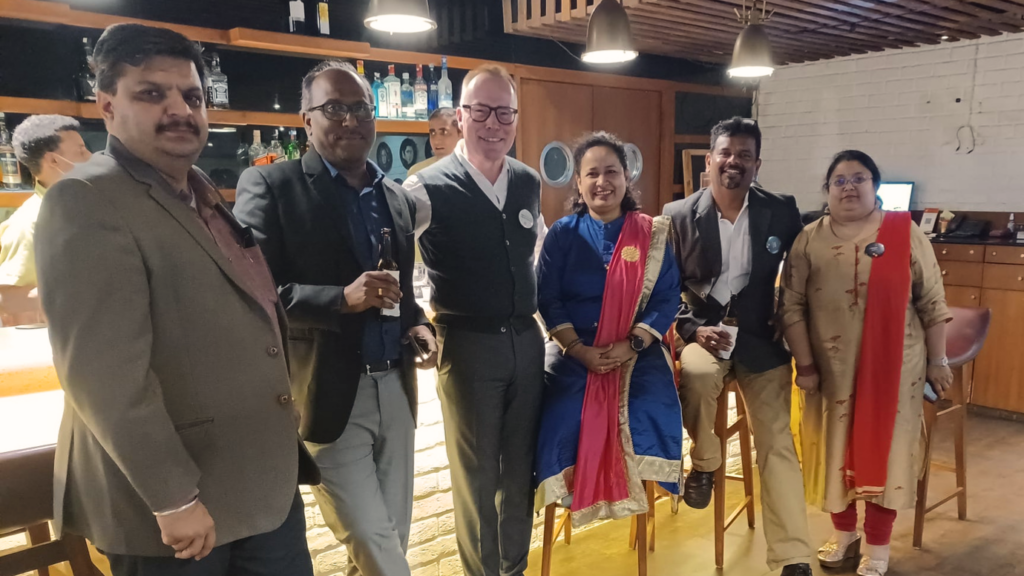
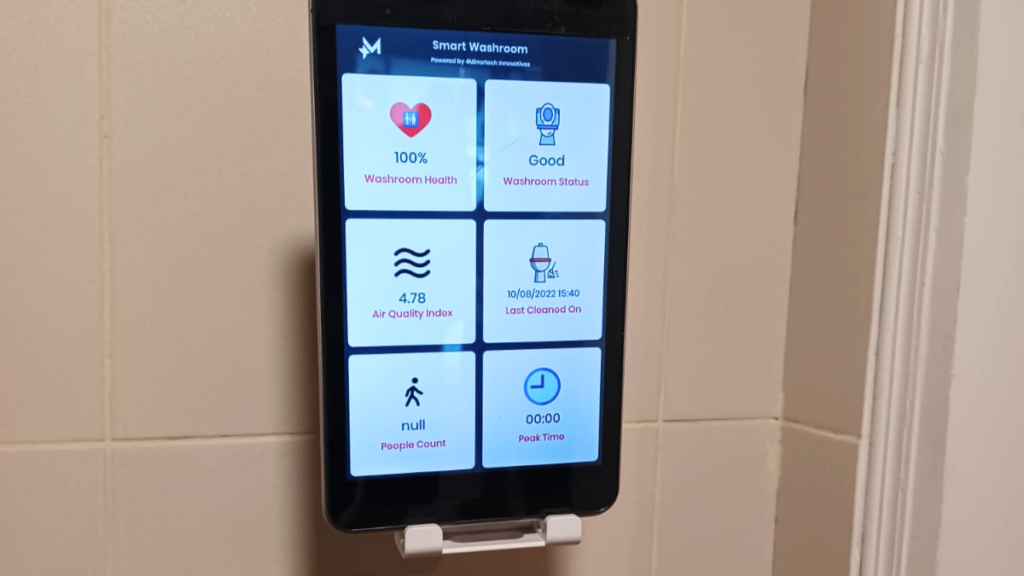
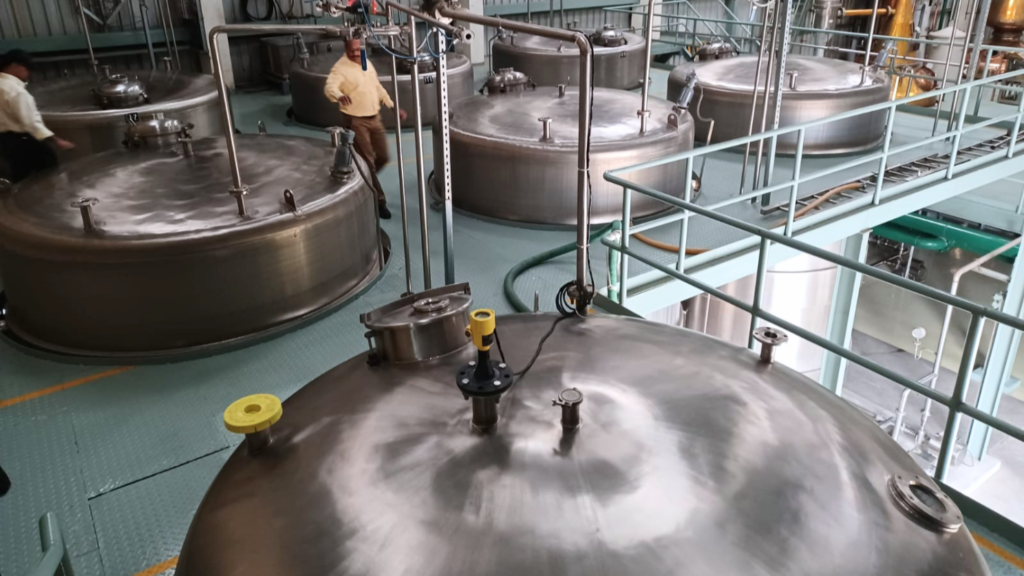
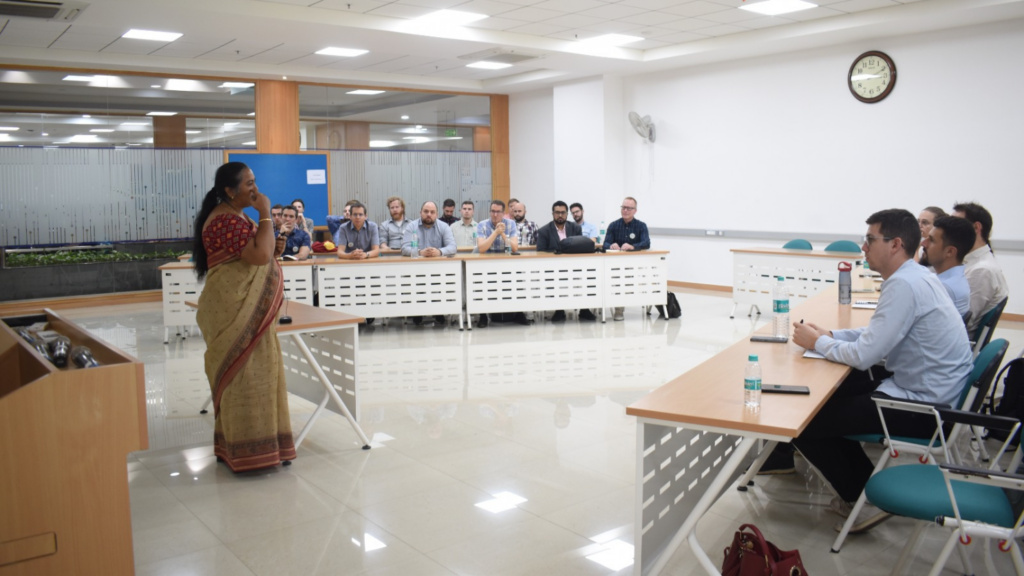

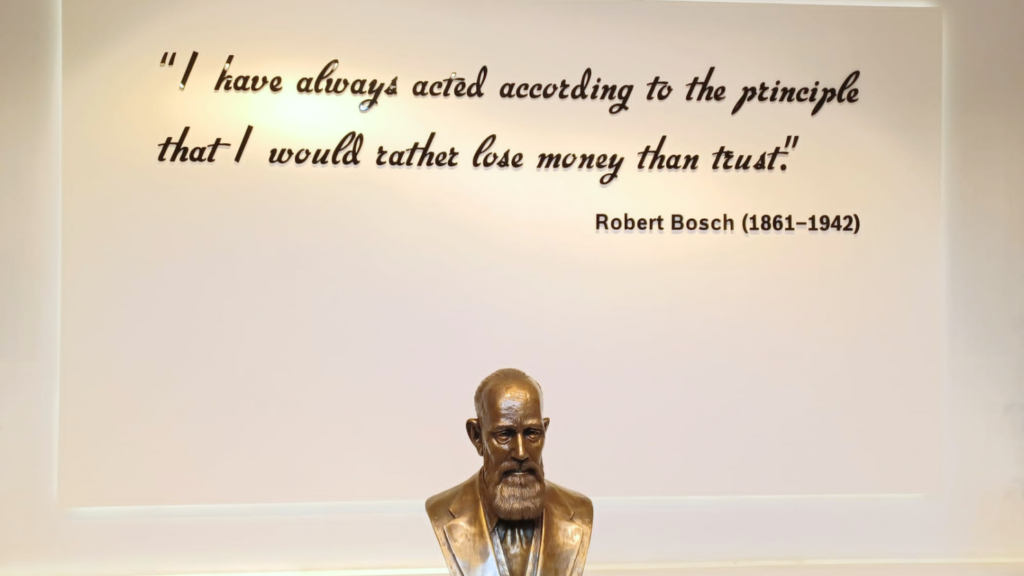
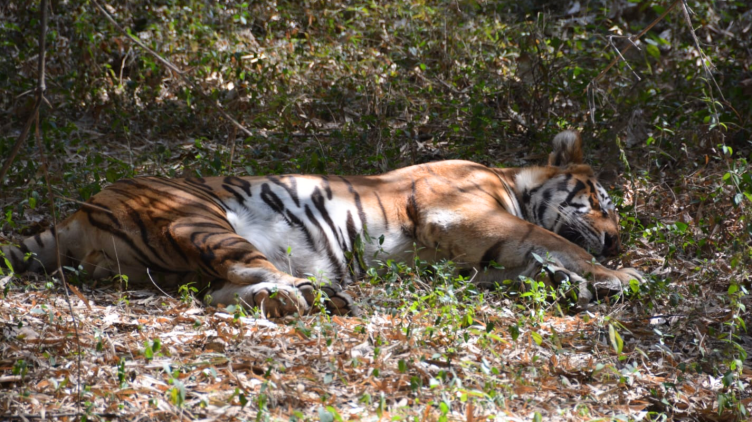
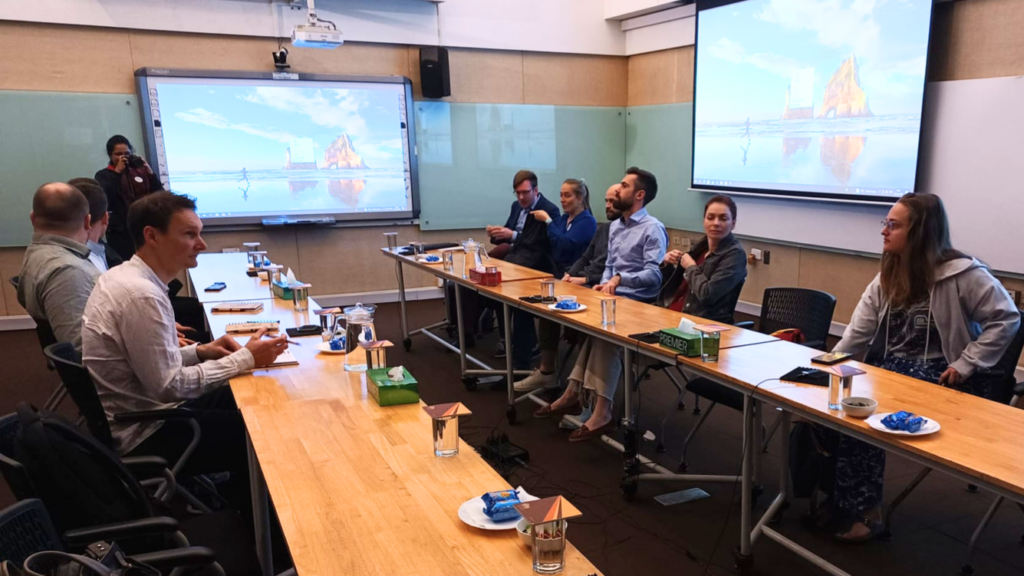
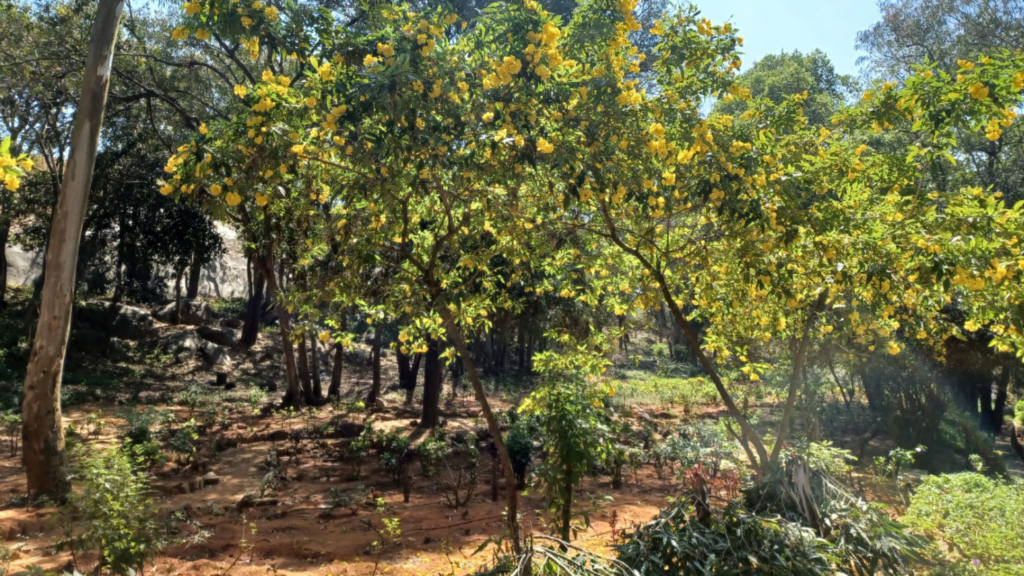
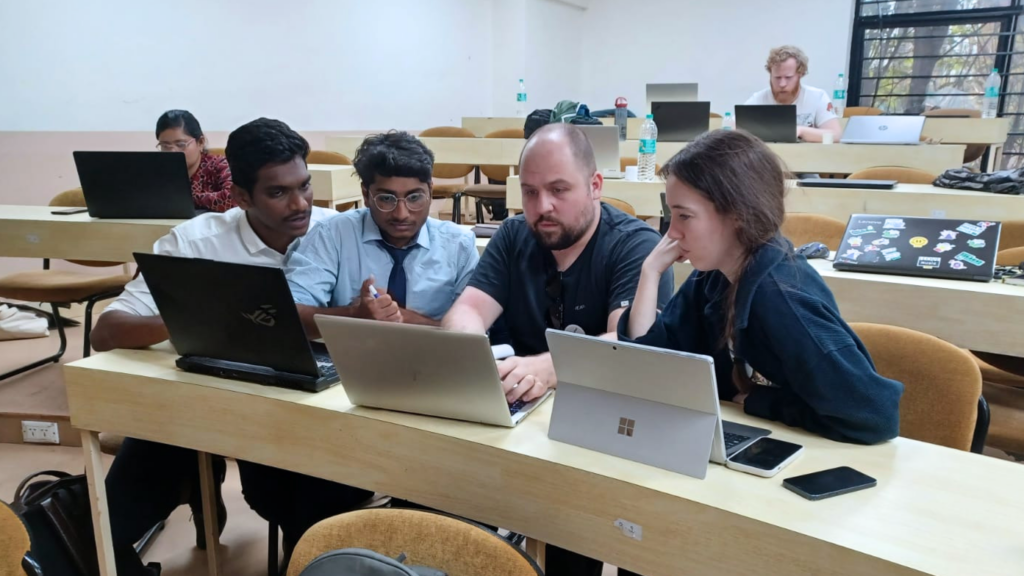


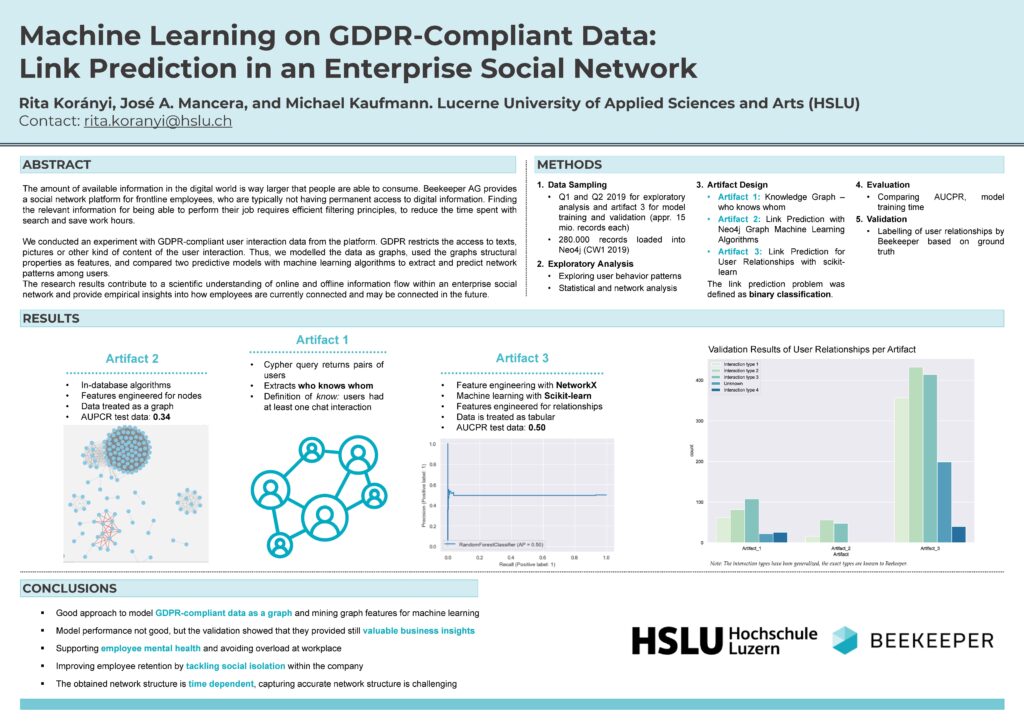


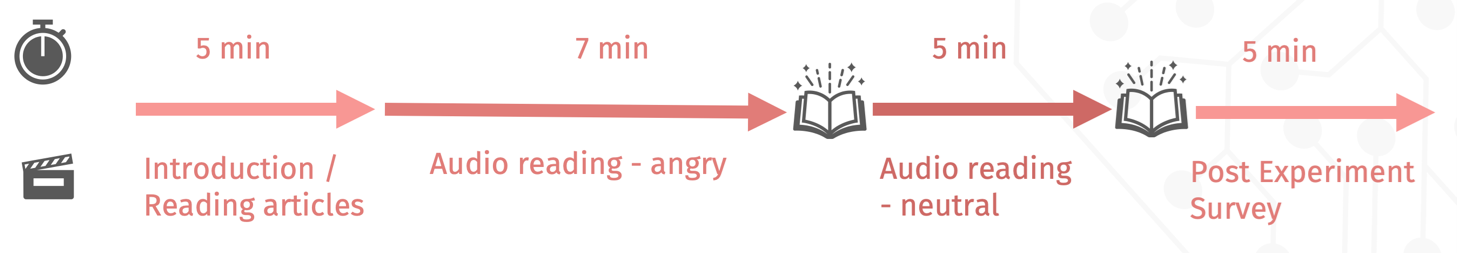
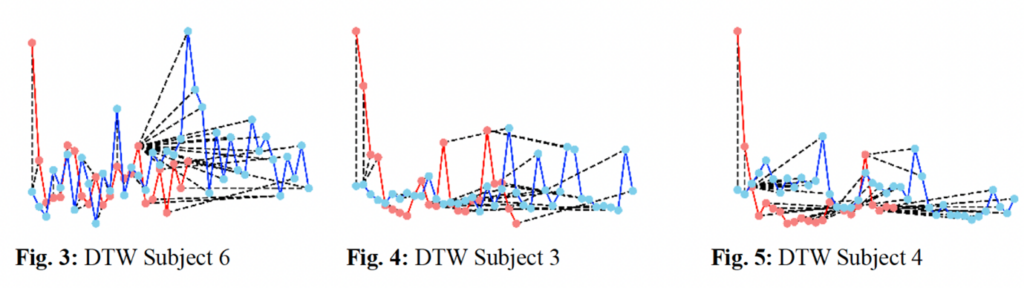

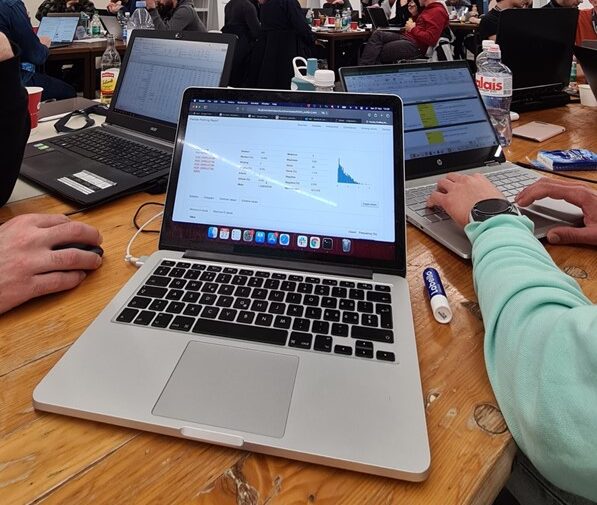
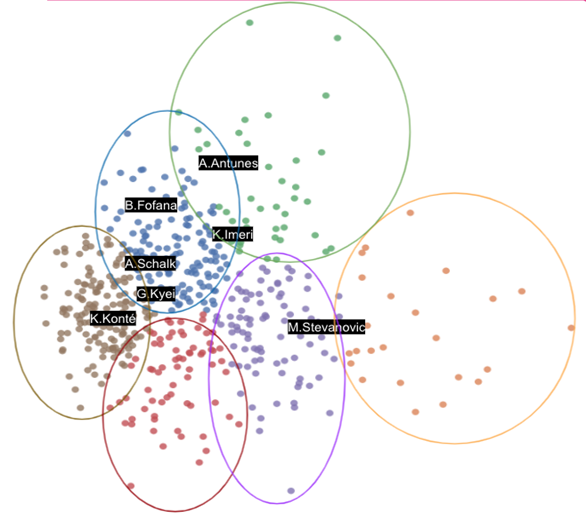

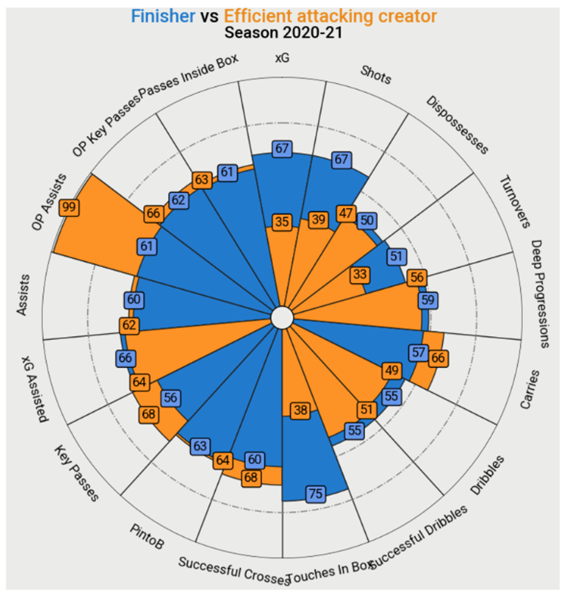


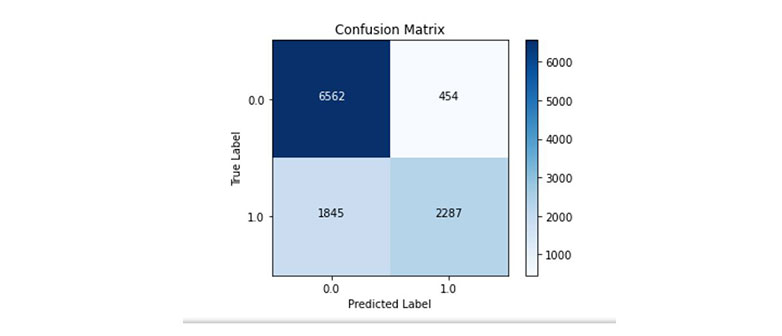
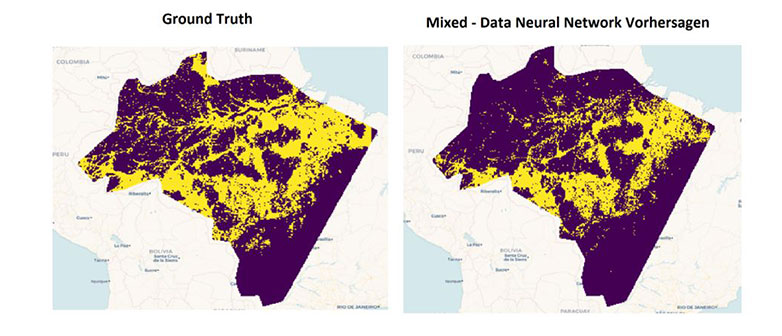