
Data Science: The Impact of COVID-19 on Business Development Using Machine Learning & Natural Language Processing Based on News
Our former HSLU and Applied Data Science student Tracey Etheridge recently attended the IEEE International Conference on Knowledge Graph (ICKG-2022) to present her Master’s thesis entitled “Distilling Business Value from COVID-19 Public Media Dataset with Machine Learning and Natural Language Processing”.
Shortcuts:
Intro | Method | Results | Outlook | Conclusion
Info-Events | Programme Information | Contact | Professional Data Science Portraits

Introduction
In this Data Science project, Tracey Etheridge used her Machine Learning and Natural Language Processing skills to innovatively analyse a very large news dataset to understand the impact of COVID-19 on business development. Most importantly, she sought to draw some useful lessons that we can apply to future crises. For the project, Tracey worked with Dr. Janna Lipenkova, CEO of Anacode GmbH in Berlin and Dr. Guang Lu, Lecturer in Data Science in Marketing at HSLU.
The year 2020 was obviously a very turbulent time for businesses as it was the first year of the COVID-19 pandemic. Surprisingly, some companies did very well at the beginning of the crisis, while others were hit hard by the pandemic. Why is this? What lessons can we learn from the past to better manage possible future crises? For her Master’s thesis, Tracey wanted to find out if there was a link between the business decisions companies made and their financial performance. To do this, she looked at news articles that mentioned COVID-19, the companies mentioned in those articles and their financial performance.
The core dataset Tracey used consisted of news articles sourced from top business blogs and news sites such as Yahoo Finance, CNN, Reuters and the New York Times. She had a collection of more than 370,000 articles published in 2020. These articles covered a wide range of topics including general business, finance, technology and science (non-medical). It also collected monthly stock prices for companies in some of the major indices in the US, UK, Canada and Australia.
Method
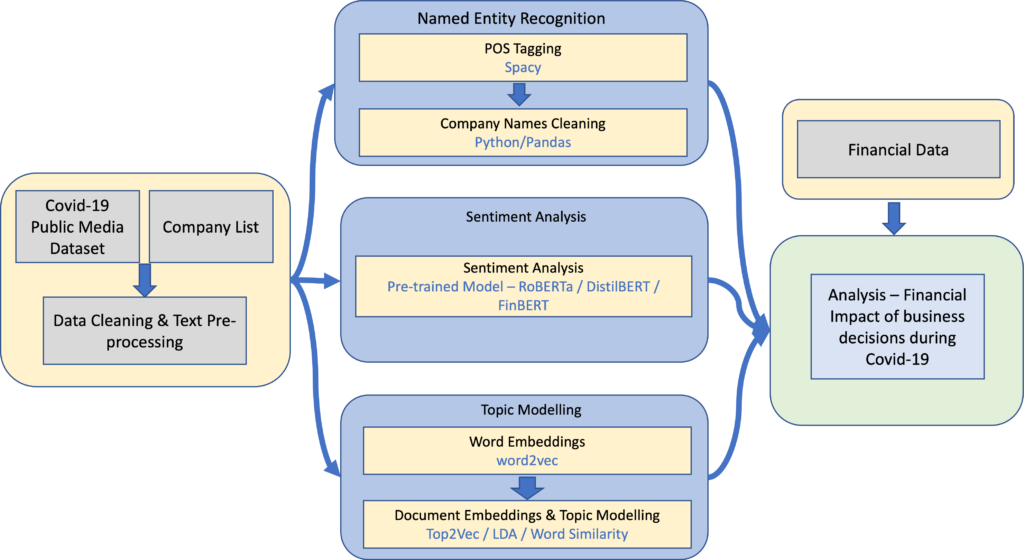
Tracey proposed a novel data analysis pipeline based on Machine Learning and Natural Language Processing (NLP) to extract business value from the news dataset. After cleaning the dataset and performing some pre-processing steps, she applied three different NLP methods to extract information from the articles (as shown in Figure 1).
First, she extracted the names of the companies mentioned in the article using named entity recognition. Second, she performed sentiment analysis on the headlines to determine whether the article was positive or negative. Finally, she applied topic modelling to understand what the main topic of the article was. Once she had completed these steps, she was able to merge them to assess whether she could find connections and information that could be useful to businesses.
To identify the companies mentioned in the articles, Tracey used spaCy to complete the named entity extraction by examining objects identified as ‘organisations’. News articles often do not give the full trade name of companies, and the initial extraction also included a number of companies that were not relevant to the analysis.
Tracey therefore developed a matching algorithm to compare the extracted values with a list of companies from the world’s major stock indices. To test the results of the matching, she manually tagged the companies mentioned in 1’000 articles. The tests showed an F1 value of 65%, which is somewhat low. This could be the cause of some potential problems in extracting relationships between the articles and financial performance.
Three models: DistilBERT, FinBERT and RoBERTa
For the sentiment analysis component, Tracey tested three models, namely DistilBERT, FinBERT and RoBERTa. She also tested a majority rule approach using the results from the three models. Tracey then manually tagged 1,000 items to test the accuracy of the sentiment analysis. RoBERTa was the best performing model, so Tracey used it in the final analysis.
Tracey then compared several different topic modelling techniques. One method Tracey used in the analysis was Top2Vec, which is based on Word2Vec and Doc2Vec. The 50 words with the closest cosine similarity values in space represented an entire topic. Tracey also assigned each document within the dataset to a topic. Using this method, Tracey created 1,700 topics.
In order to understand these topics, Tracey had to manually analyse them and give them a meaningful label. However, they were mostly very general and contained a large number of documents, making it difficult to use them to distinguish between companies. So Tracey used an alternative method of defining themes by selecting words that were representative of them. For example, for the topic of ‘cybersecurity’, she selected the words ‘cyber-attack’, ‘malicious’ and ‘vulnerability’.
Using the embeddings trained with the Word2Vec component of the Top2Vec model, Tracey took the average embeddings of these words as representative of the topic. She compared the topic embeddings with the average embedding of the words contained in the document and took the articles that were closest to the topic as related.
Results
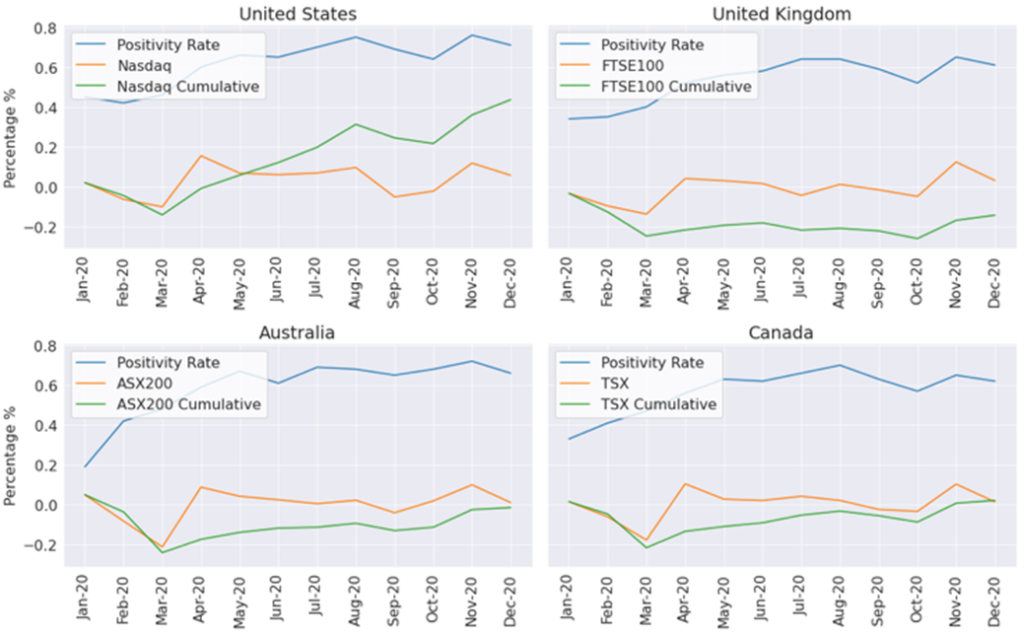
The results of the analysis focused on three areas by examining financial performance at country and industry level as well as for individual companies. Figure 2 shows an analysis of the average sentiment of companies from different countries together with the financial performance of the main stock index in that country. There is a slight pattern here – in the early months when positivity was lower, index returns for individual countries are lower than later in the year when positivity is higher and returns are also higher.
Either positive or negative effects
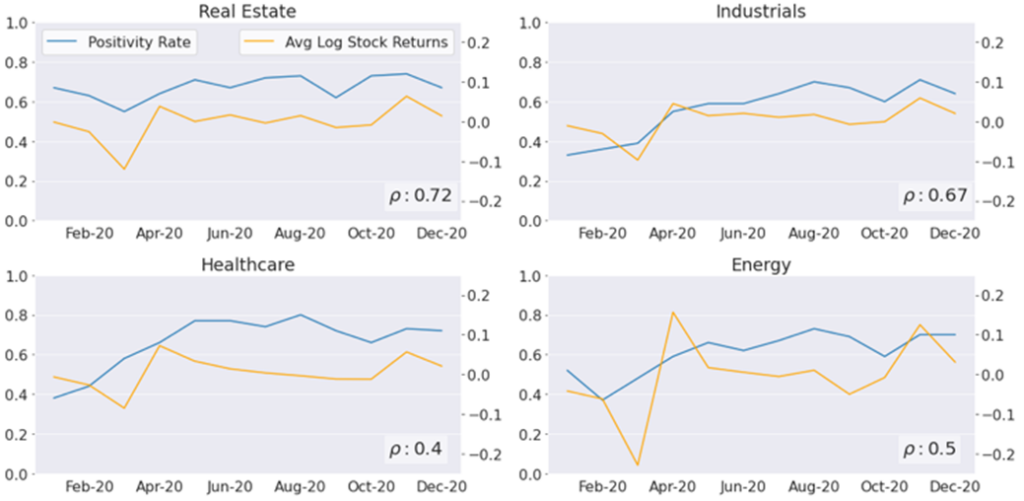
At the industry level, COVID-19 clearly affected different industries in different ways. While many industries were negatively affected, others were positively affected. For example the pharmaceutical industry through the successful development of COVID-19 vaccines or technology companies through increased reliance on technology.
Figure 3 shows the sentiment and market movement for a selection of industries. Real estate and industrials have a relatively high correlation between the sentiment and market movement, while the correlations between the two are rather low for healthcare and energy. This suggests that sentiment can be an indicator of how an industry is performing depending on the sector.
However, Tracey would need to analyse longer-term data to gain a better understanding of the correlations shown here.
Tracey moved to the corporate level. To do this, she started to look at the topics in more detail. She wanted to find out what the key issues were for particular companies and what the market sentiment was on these issues. She could then combine this with company’s financial performance. As the real estate industry has a reasonable degree of correlation between sentiment and market performance, she looked more closely at the topics associated with the best and worst performing companies in the industry.
In doing so, she looked at the topics that emerged from the Top2Vec model. As mentioned earlier, some of these topics are very general and do not allow for much differentiation. However, one can see some negative topics associated with the worst performing companies, such as ‘bankruptcy’ and ‘litigation’.
Thoughts and outlook
If we continue to look at the themes, but now consolidate the companies at the industry level, we can also see some interesting results. For this dataset and the year of analysis, there are many topics related to COVID-19, as this topic was so present in the media and was a focus of this dataset. However, the information could be more focused on the needs of a particular company by focusing on one industry.
For example, in the consumer discretionary industry, technology topics are strong among companies with a high positivity rate, while topics related to clothing retailers and physical stores are common among companies with a low positivity rate. Information such as this could indicate to companies that they should focus on their technology solutions in market updates, hopefully influencing media perceptions in a positive way.
Conclusion
Overall, there were many aspects that Tracey explored in this analysis. The interesting findings can be divided into two main areas. Firstly, when comparing article sentiment to monthly industry financial performance, the results show that sentiment can be an indicator of an industry’s performance depending on the industry. Second, companies could use the results of topic modelling and sentiment analysis to gain information about the media’s attitude towards company issues. Or to identify important topics related to competitors.
This information could help inform overall corporate strategy and communications. A further consideration for the future is whether improved topic generation could enable deeper, more meaningful connections between the elements studied. Since the completion of this work, the dataset has been extended to 2022. Therefore, it would be particularly interesting to extend the time span and see if the correlations between sentiment and financial performance persist over time.
Interested in more information?
Click here to read the full paper Tracey presented at the Conference.
Read the professional portrait with Data Scientist Tracey Etheridge here.
We would like to thank Dr. Guang Lu for sharing this very interesting project portrait with us!
Reference
T. Etheridge, G. Lu, and J. Lipenkova, 2022. Distilling Business Value from COVID-19 Public Media Dataset with Machine Learning and Natural Language Processing. In: Proceedings of IEEE International Conference on Knowledge Graph (ICKG-2022), 30 November – 1 December 2022, Orlando, FL, USA.
Info-Events
Start your career with the MSc in Applied Information and Data Science now!
Join one of our online Info-Events:
Monday, 10 August 2026 (Online, English)
Monday, 7 September 2026 (Online, German)
Monday, 5 October 2026 (Online, English)
Monday, 2 November 2026 (Online, English)
Friday, 27 November 2026 (Online, German)
Monday, 11 January 2026 (Online, English)
Programme Information | Contact | Info-Events
Interested in the MSc in Applied Information and Data Science?
Visit our Info-Events. We look forward to meeting you!
Please contact us if you have any questions about your studies:
Tel.: +41 41 228 41 30
Email: master.ids@hslu.ch
Further links to the programme:
→ Generalist profile
→ Career profiles and study insights
→ Our Lecturers
→ Course structure and modules
→ Working and studying
→ Admission and registration
→ FAQ
